

Chapter summary
Note: This guide compares platform pricing models (what vendors meter and charge for). For the economics of running evaluations across judge tokens, sampling strategy, production vs. offline cost, see LLM evaluation costs.
This guide was last updated on August 10, 2026.
Short answer: AI observability platforms do not charge for the same thing. LangSmith meters traces and seats; Langfuse counts traces, observations, and scores as units; Braintrust meters processed data and scores; Datadog bills LLM spans; and Arize AX meters spans and ingested data. The useful comparison starts with what your application makes each meter count.
AI observability pricing is hard to compare because vendors meter fundamentally different things. That gets harder as applications become agentic: one request can fan out into model calls, tools, retrievers, sub-agents, retries, evaluators, and large payloads. The same workload can therefore behave very differently under different billing models.
Kyle Poyar, who has spent 15 years inside SaaS pricing, has a clean explanation for why this happened. AI products do work on your behalf instead of being a place you log in to do work, so they behave more like a system of action than a system of record. You cannot meter a system of action the way you metered a database, and the old per-seat playbook stopped mapping to value. His monetization research shows the category has largely settled on usage-based and hybrid models as a result. The catch is that “usage” is exactly where everyone diverges.
This guide maps the major pricing models, explains what makes each bill move, and gives you a repeatable way to compare vendors on your own workload. We are a vendor in this category, so we will also say where the Arize model creates work for buyers instead of pretending it is perfect.
Pricing changes quickly. The plan details below were verified against vendor-published pricing and documentation on August 7, 2026. Enterprise contracts, negotiated commits, and startup discounts can change the actual numbers.
Why AI observability pricing moved beyond seats
For most of software history, per-seat pricing was the default, and for good reason. It was predictable, procurement understood it, and you could forecast the bill from your headcount.
Among the platforms in this comparison, LangSmith is the holdout: its paid self-serve model still layers a per-seat charge underneath trace-based usage. The others have largely moved away from charging for access and toward charging for the work the system performs or the telemetry it produces.
That’s because agents break the link between seats and value. An agent can do more work because traffic grows, because its workflow becomes deeper, or because your team evaluates it more aggressively, without adding another human user to the observability platform. Increasingly, the actors generating that work are agents and automated workflows themselves, not just people logging into software. Headcount becomes an even weaker proxy for usage as more of the work shifts from humans to software.
That makes seats a poor fit for AI observability. Adding an annotator, reviewer, product manager, or on-call engineer does not inherently create more work for the system, while one existing user can generate dramatically more usage as an agent becomes more complex or evaluation coverage expands. Charging for access is a holdover from software whose value scaled with the number of people logging in. AI systems increasingly scale with the work they perform instead.
That is why most of the category has moved toward usage-based and hybrid pricing: traces, spans, events, stored bytes, scores, or combinations of them.
Don’t start by asking about the price per unit. Instead, you should start by asking what the unit is and what causes it to grow.
AI observability pricing models at a glance
Once you leave seats behind, you have to pick a unit. That’s where the category splits, and what each choice does in practice.
The table below compares the shape of each pricing model: what the vendor meters, how evaluation affects that meter, and what deployment options exist. That is more useful than forcing every vendor into a synthetic cost-per-million comparison because the underlying meters are genuinely different.
| Vendor | Primary meter | How evaluation affects usage | Self-host path |
|---|---|---|---|
| LangSmith | Traces, with a Plus seat fee and retention upgrades | Evaluator/playground executions are traces; feedback, online evals, and annotation workflows can upgrade traces to extended retention | Enterprise self-hosted or hybrid |
| Langfuse | Units = traces + observations + scores | Each stored score is a unit, and traces/observations created by Langfuse evaluation features also count | OSS self-hosting under MIT license |
| Braintrust | Processed data in GB + scores; model credits are another axis | Each score counts against a separate score allowance/overage meter | Enterprise self-hosted/on-prem options |
| Datadog | LLM spans only | No separate eval product fee; LLM calls made by evaluators count as LLM spans | Standalone SaaS product; no public self-hosted Agent Observability tier. |
| Arize AX | Trace spans + ingested data | No separate per-score platform meter; ingested evaluator telemetry still uses the underlying span/data meters. | Phoenix OSS; AX Enterprise self-hosted |
Meters, tiers, and included volumes change often in this category. Treat this as a map of the models, and verify specifics against each vendor’s current pricing page before you budget.
Build better agents with Arize
Trace, evaluate, and learn. Build agents that work with Arize AX and start tracing your runs today.
Prefer open source? Try Arize Phoenix for self-hosted, open source agent observability.

What each vendor meters for pricing
LangSmith: traces, seats, and retention
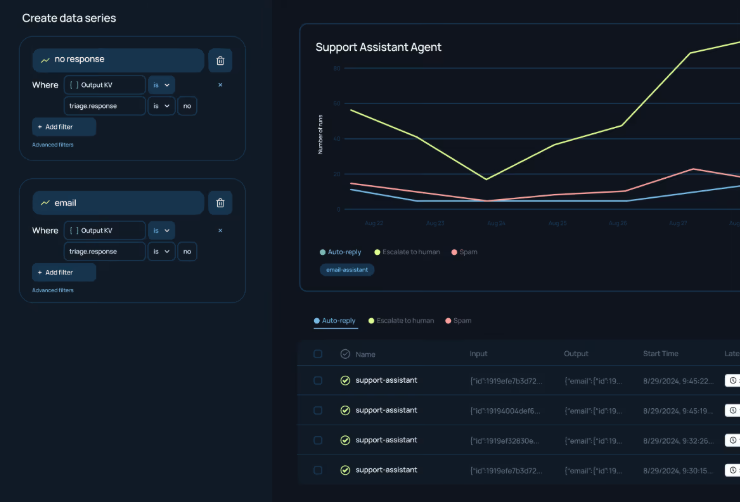
LangSmith defines a trace as one execution of an application, evaluator, or playground session per its published pricing. A trace can contain many child runs, including model calls, retrieval steps, and tool calls. That distinction matters for agentic systems: a ten-step agent is not automatically ten billable traces simply because it contains ten runs.
A RAG query with retrieval, reranking, and generation can therefore remain one application trace. Trace count grows when the workflow creates additional executions, including separate evaluator or playground runs, rather than simply because the application contains more internal steps.
LangSmith’s self-serve model combines included trace volume with a per-seat charge on its paid tier and usage charges above the included allowance. LangSmith has base and extended retention tiers: base traces are retained for 14 days and extended traces for 400 days.
Evaluation can also affect retention, but the details matter. Online evaluators and automation rules can upgrade traces to extended retention when retention extension is enabled; it is enabled by default for new evaluators and rules, but teams can opt out. Feedback submitted through the API or SDK extends retention only when the request explicitly enables it. Feedback entered in the LangSmith UI, notes, and manual annotation-queue additions do not upgrade retention by default.
Who LangSmith is a good fit for: teams that value a trace-centric workflow, especially LangChain or LangGraph users, though LangSmith supports other stacks as well. Model carefully around seat count, application and evaluator execution volume, and the evaluation or automation settings that can move traces into extended retention.
Langfuse: traces, observations, and scores in one unit meter
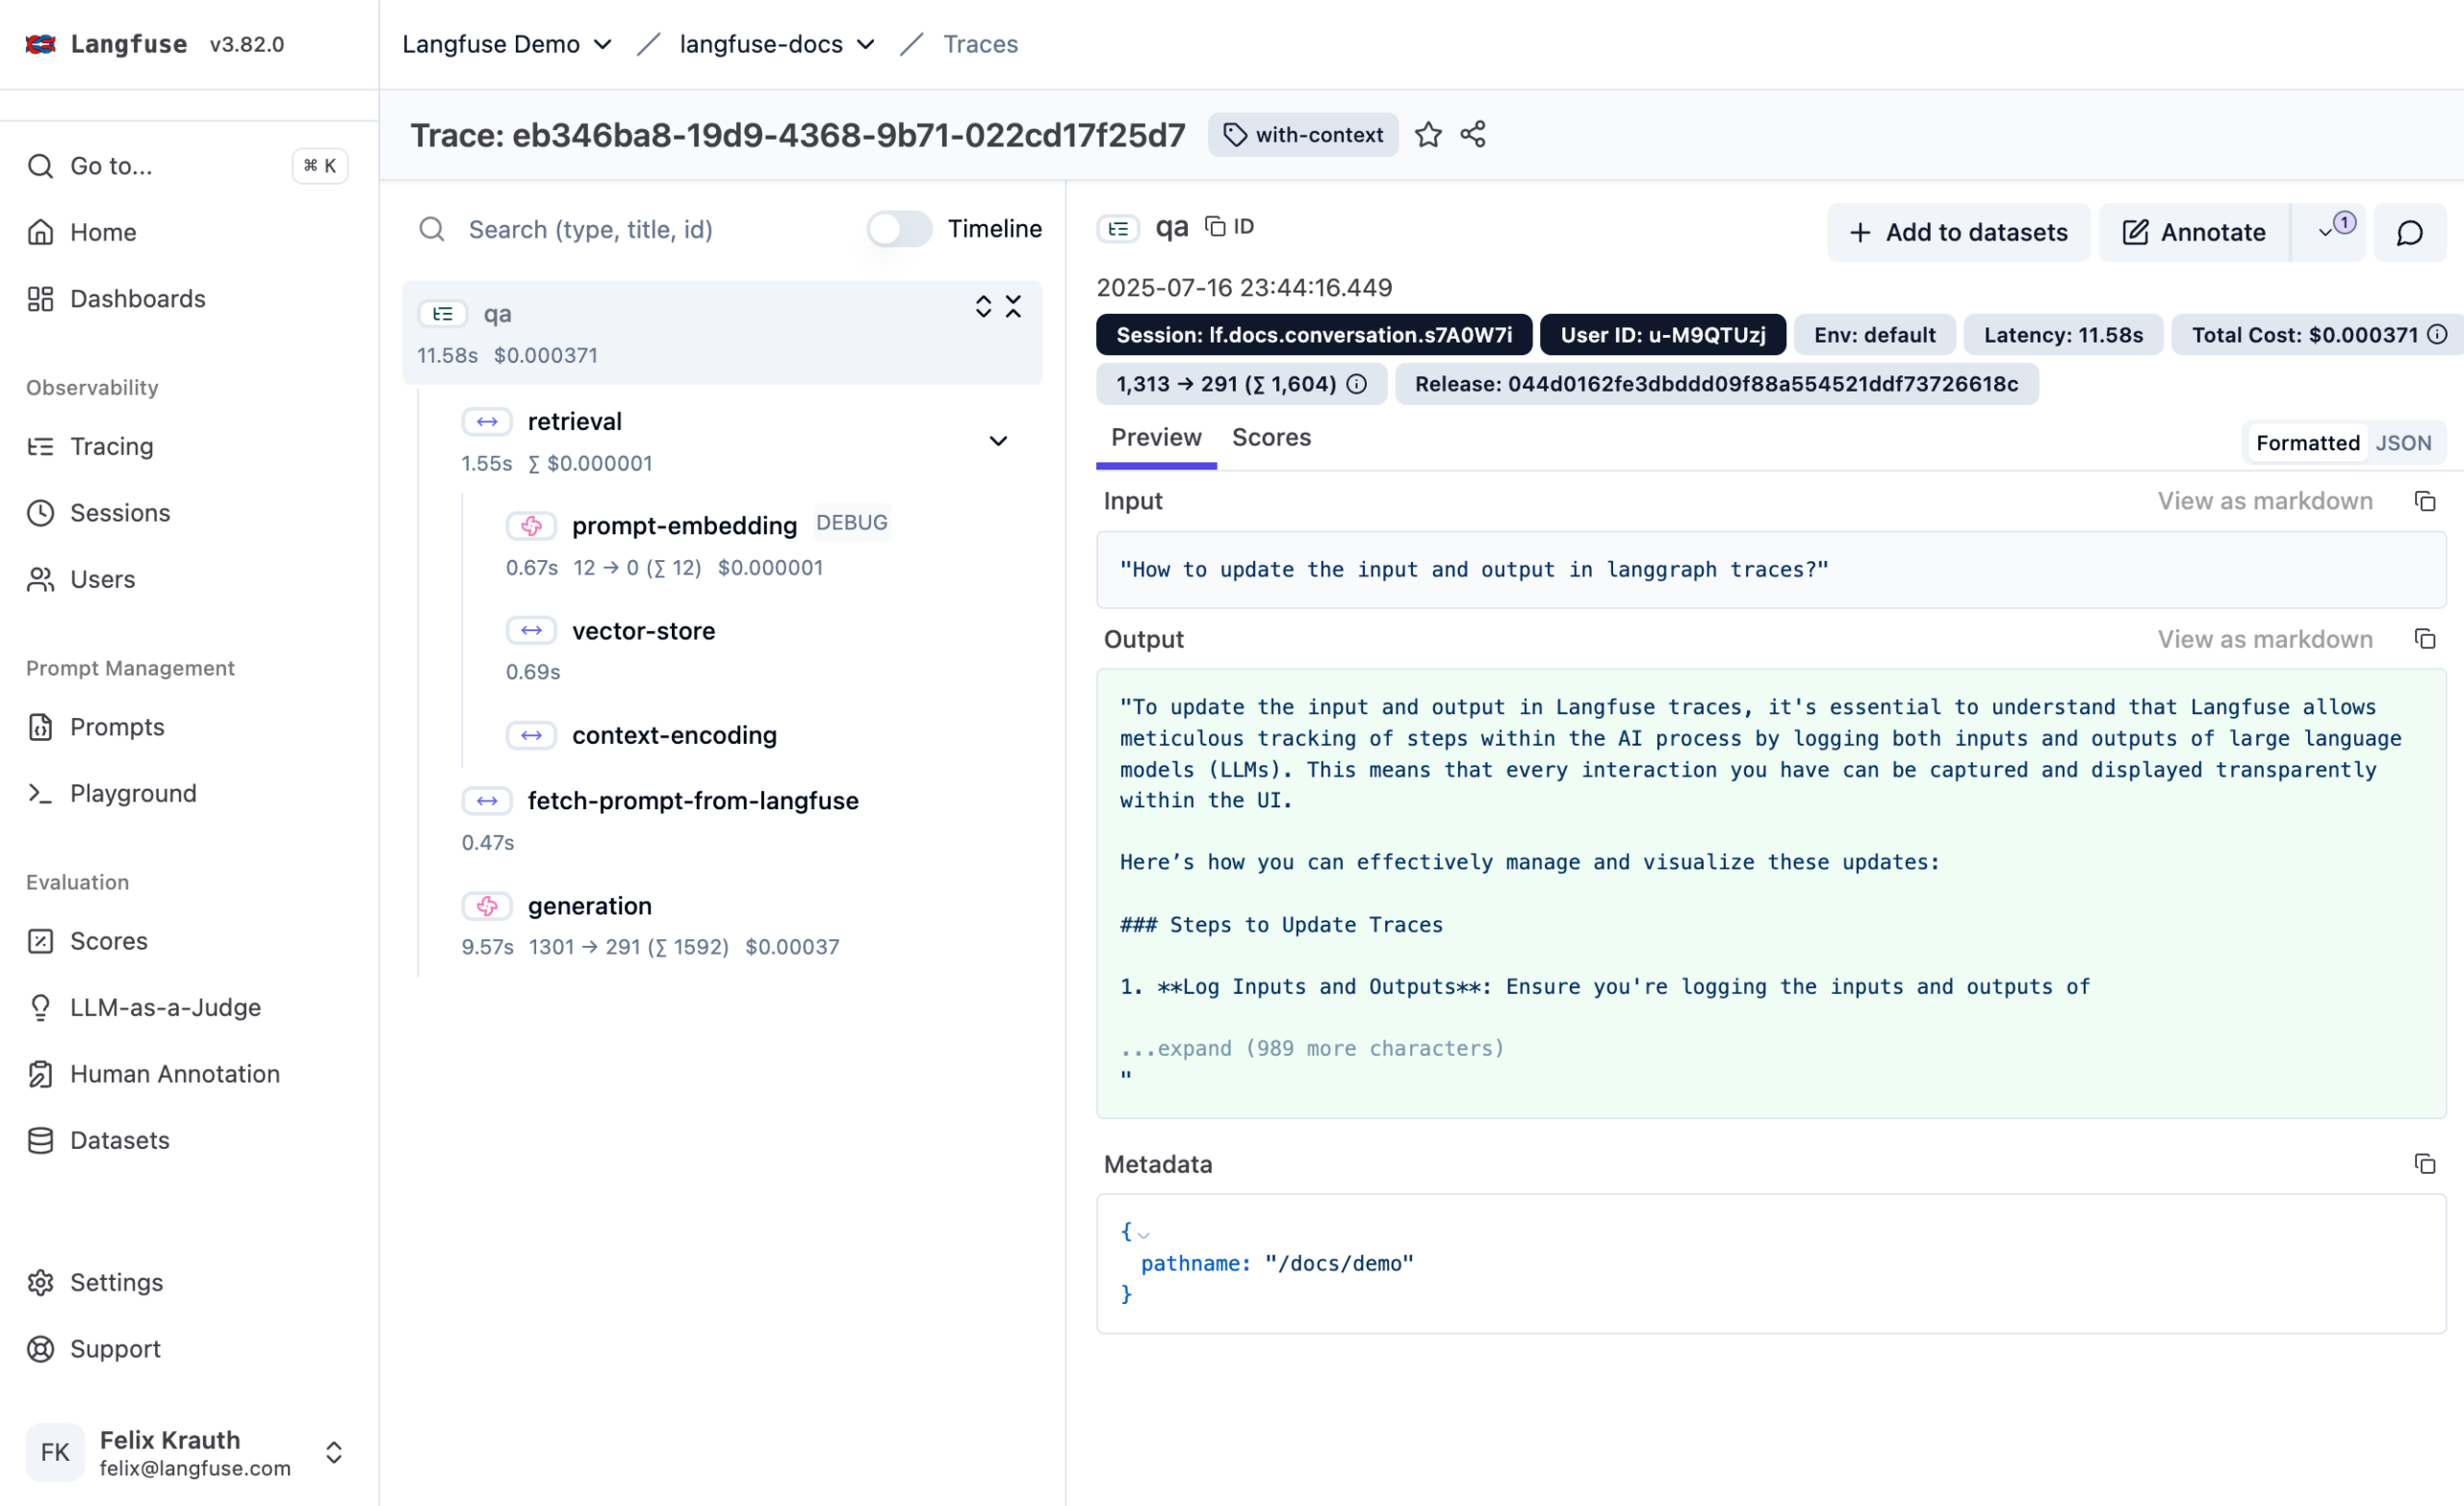
Langfuse bills “units,” and a unit is any single thing you send: a trace, an observation such as a span or a generation, or a score. There is no per-seat charge, the free tier is generous, and because the core is open source and licensed under MIT you can self-host and pay only for your own infrastructure.
All of that makes the billing logic straightforward, but it also means instrumentation depth and evaluation volume push the same meter. The tradeoff is bundling: traces, spans, and scores all feed one meter, so both deep instrumentation and heavy evaluation inflate the same number.
A multi-step agent can create one trace plus many observations for generations, tools, retrieval, and other operations. Add scores from LLM-as-a-judge, code evaluators, annotations, or experiments and those score objects also count as units. Paid cloud tiers have unlimited users, while the free Hobby tier is capped at two users. The open-source version can be self-hosted under the MIT license.
Who Langfuse is a good fit for: teams that want framework-agnostic tracing and a low-cost cloud entry point. If open-source self-hosting is the main attraction, compare Langfuse directly with Arize Phoenix rather than treating OSS deployment as a Langfuse-specific advantage. Model carefully around the fact that traces, observations, and scores all feed the same unit meter. That includes scores created through annotation workflows, so deeper instrumentation, broader evaluation coverage, and more human review can all increase usage.
Braintrust: processed data plus scores
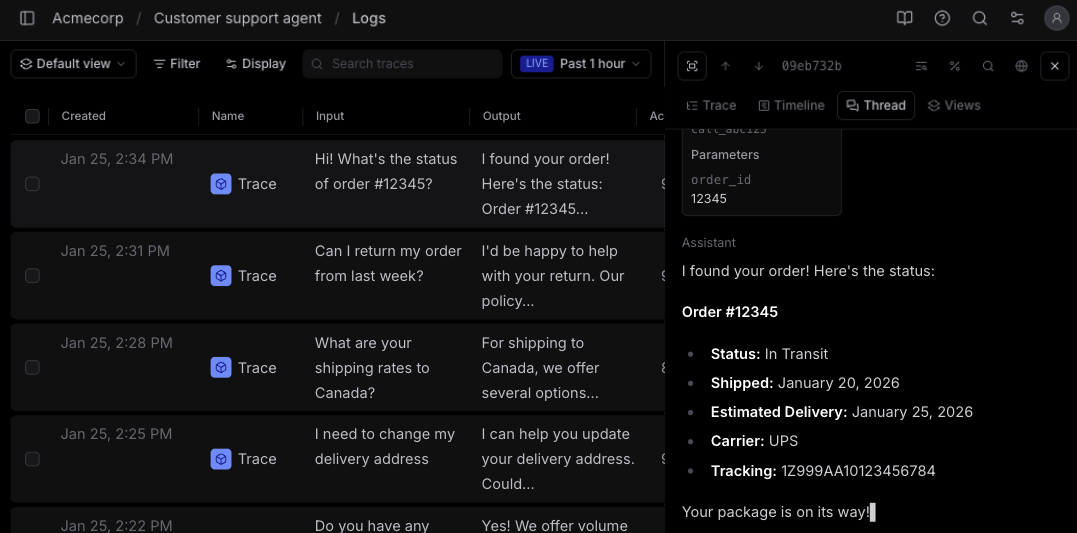
Braintrust combines tracing and evaluation with datasets, experiments, playgrounds, and related development workflows per its published pricing. Its pricing model has a different shape from event-count models: the main public self-serve meters are processed data, measured in gigabytes, and scores.
Processed data includes bytes associated with logs, experiments, datasets, prompts, metadata, traces, spans, attachments, and related content. Scores produced by LLM-as-a-judge, autoevals, or custom code scorers draw from a separate score allowance.
That means request count alone does not predict the bill. A terse classifier and a RAG agent carrying long retrieved documents can generate very different processed-data volumes at the same traffic level. The same is true for multimodal applications: an app serving only 100 interactions per day can still generate substantial processed-data volume if each interaction includes high-resolution images or other large attachments. Low request volume does not necessarily mean low usage on a byte-based meter, which can make early-stage capacity planning less intuitive. Evaluation coverage then creates a second cost curve because every recorded score contributes to the score meter.
Who Braintrust is a good fit for: teams that want tracing and evaluation alongside datasets, experiments, and playground workflows, with unlimited users on the public self-serve plans. Model carefully around processed bytes, score volume, and retention, especially for long-context, multimodal, or attachment-heavy workloads.
Datadog: LLM spans only
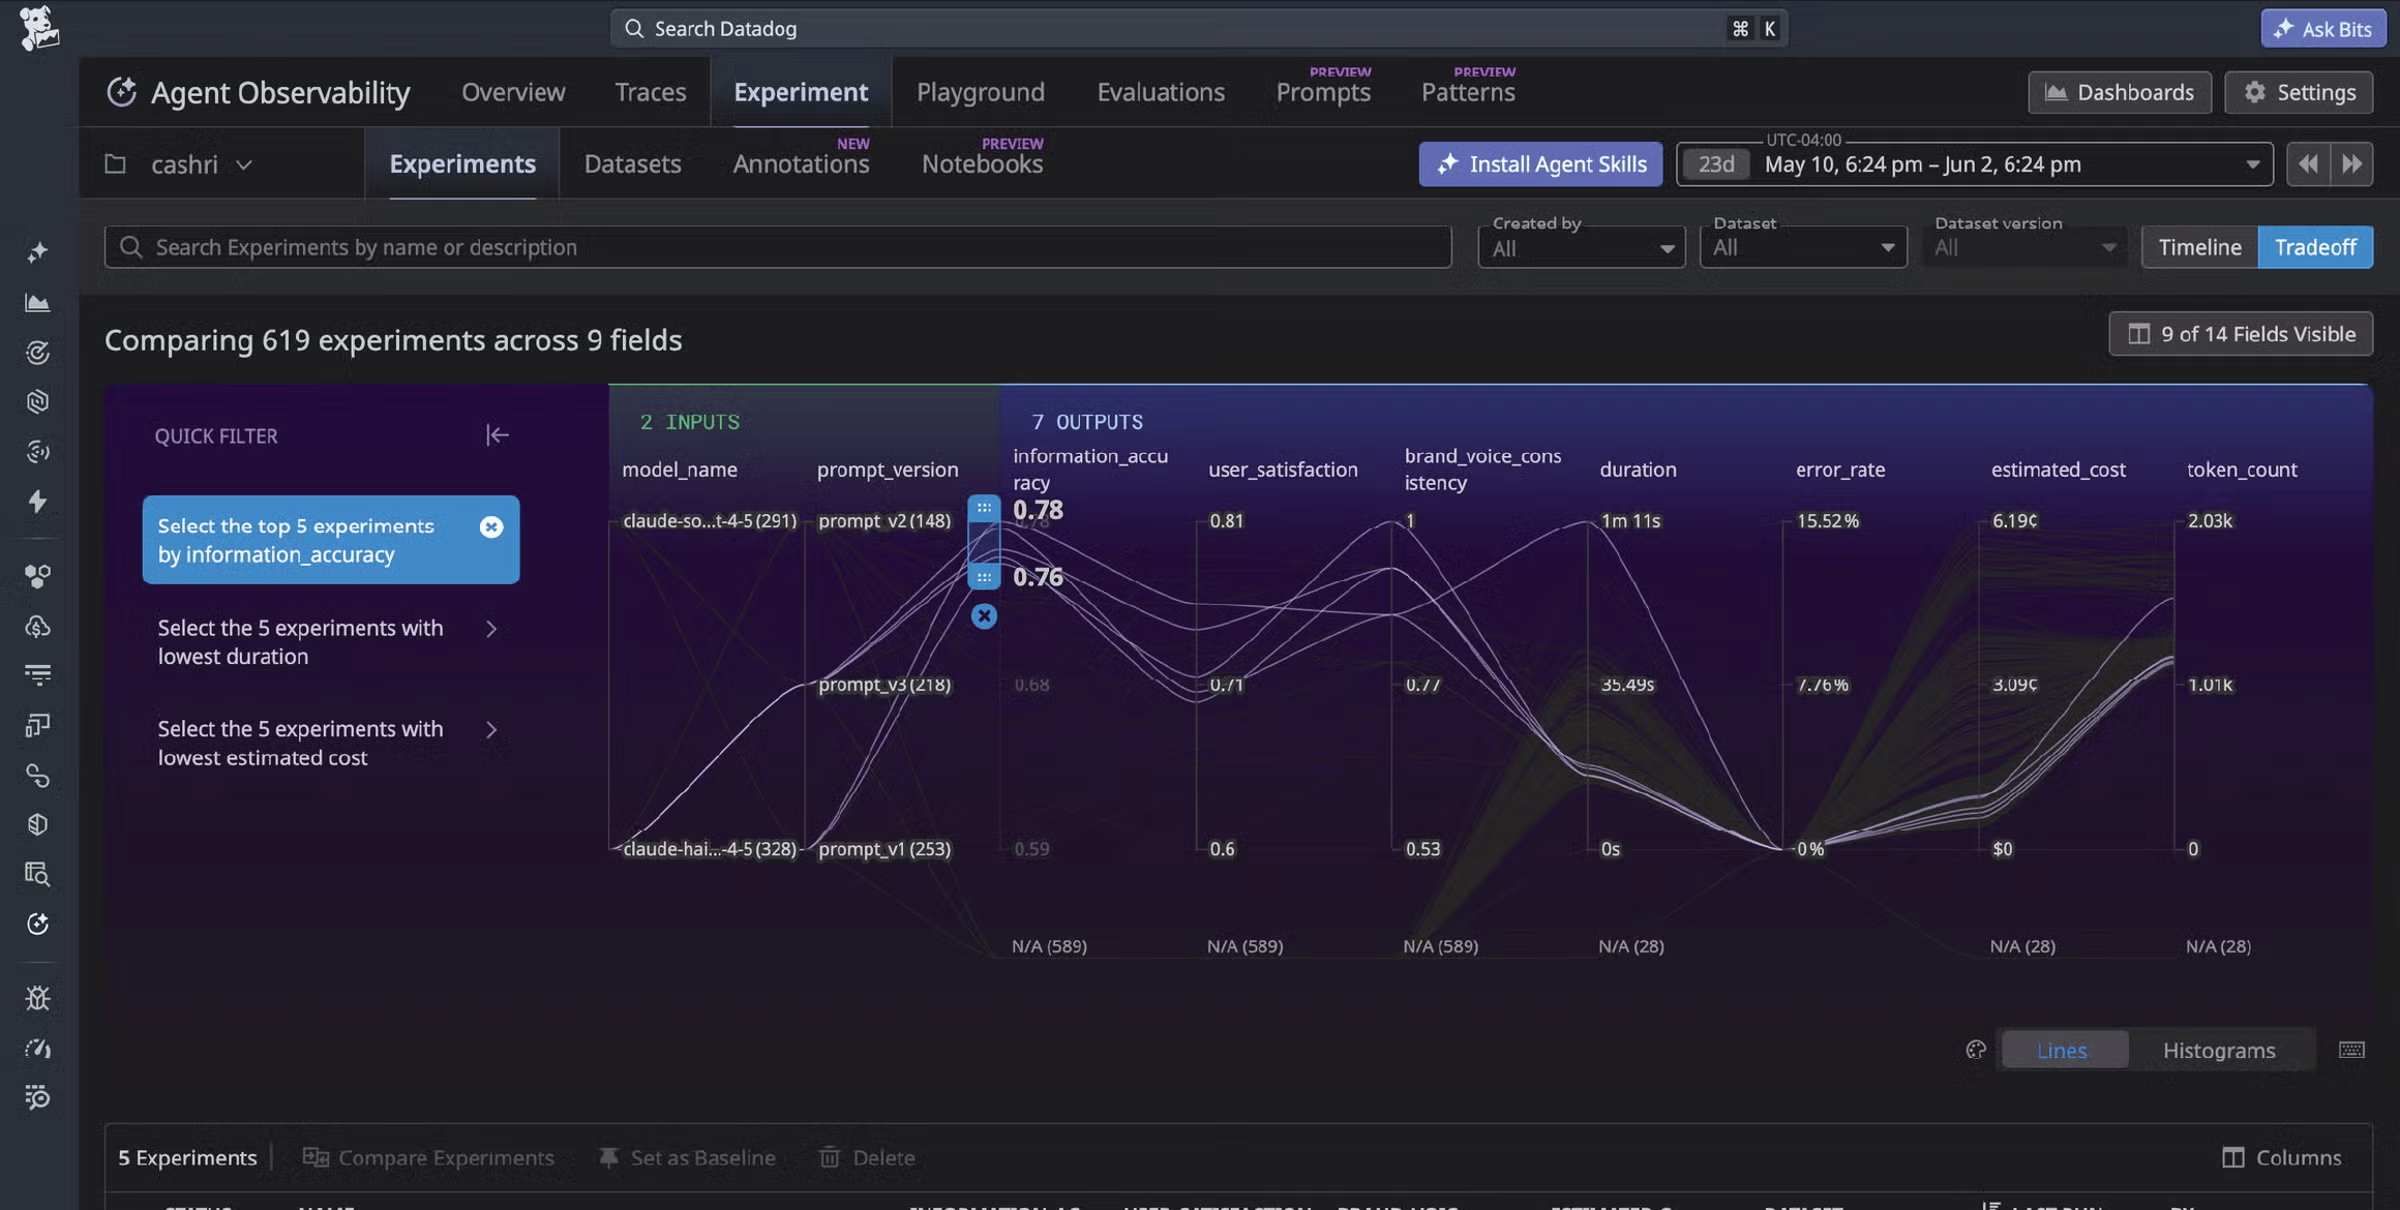
Datadog Agent Observability bills on LLM spans, where one LLM span represents a call to an LLM provider. Tool, workflow, agent, embedding, and retrieval spans can still be captured as part of the trace, but they do not contribute to the Agent Observability usage meter per its published pricing documentation.
That creates a relatively direct forecasting question: how many model calls does the application make? A multi-step agent can contain many operations without every operation becoming billable, while an architecture that makes several model calls per turn will generate several LLM spans.
Evaluation is included in the product rather than metered through a separate score allowance. If an LLM-as-a-judge evaluator makes an instrumented model call, however, that call is still an LLM span and contributes to normal usage.
Self-serve tiers include an allowance of LLM spans, with additional usage rates varying by commitment length. The default retention window is measured in days, with longer retention available as a paid add-on.
Agent Observability can be purchased without another Datadog subscription. The consolidation advantage becomes more relevant for teams that already use Datadog: agent telemetry can be correlated with application, infrastructure, and user-experience data in the same platform.
Who Datadog is a good fit for: teams that prefer a model-call-based usage meter and teams that value correlating agent behavior with broader Datadog telemetry. Model carefully around LLM calls per workflow, evaluator model calls, and the retention window you need.
Arize AX: spans plus ingested data
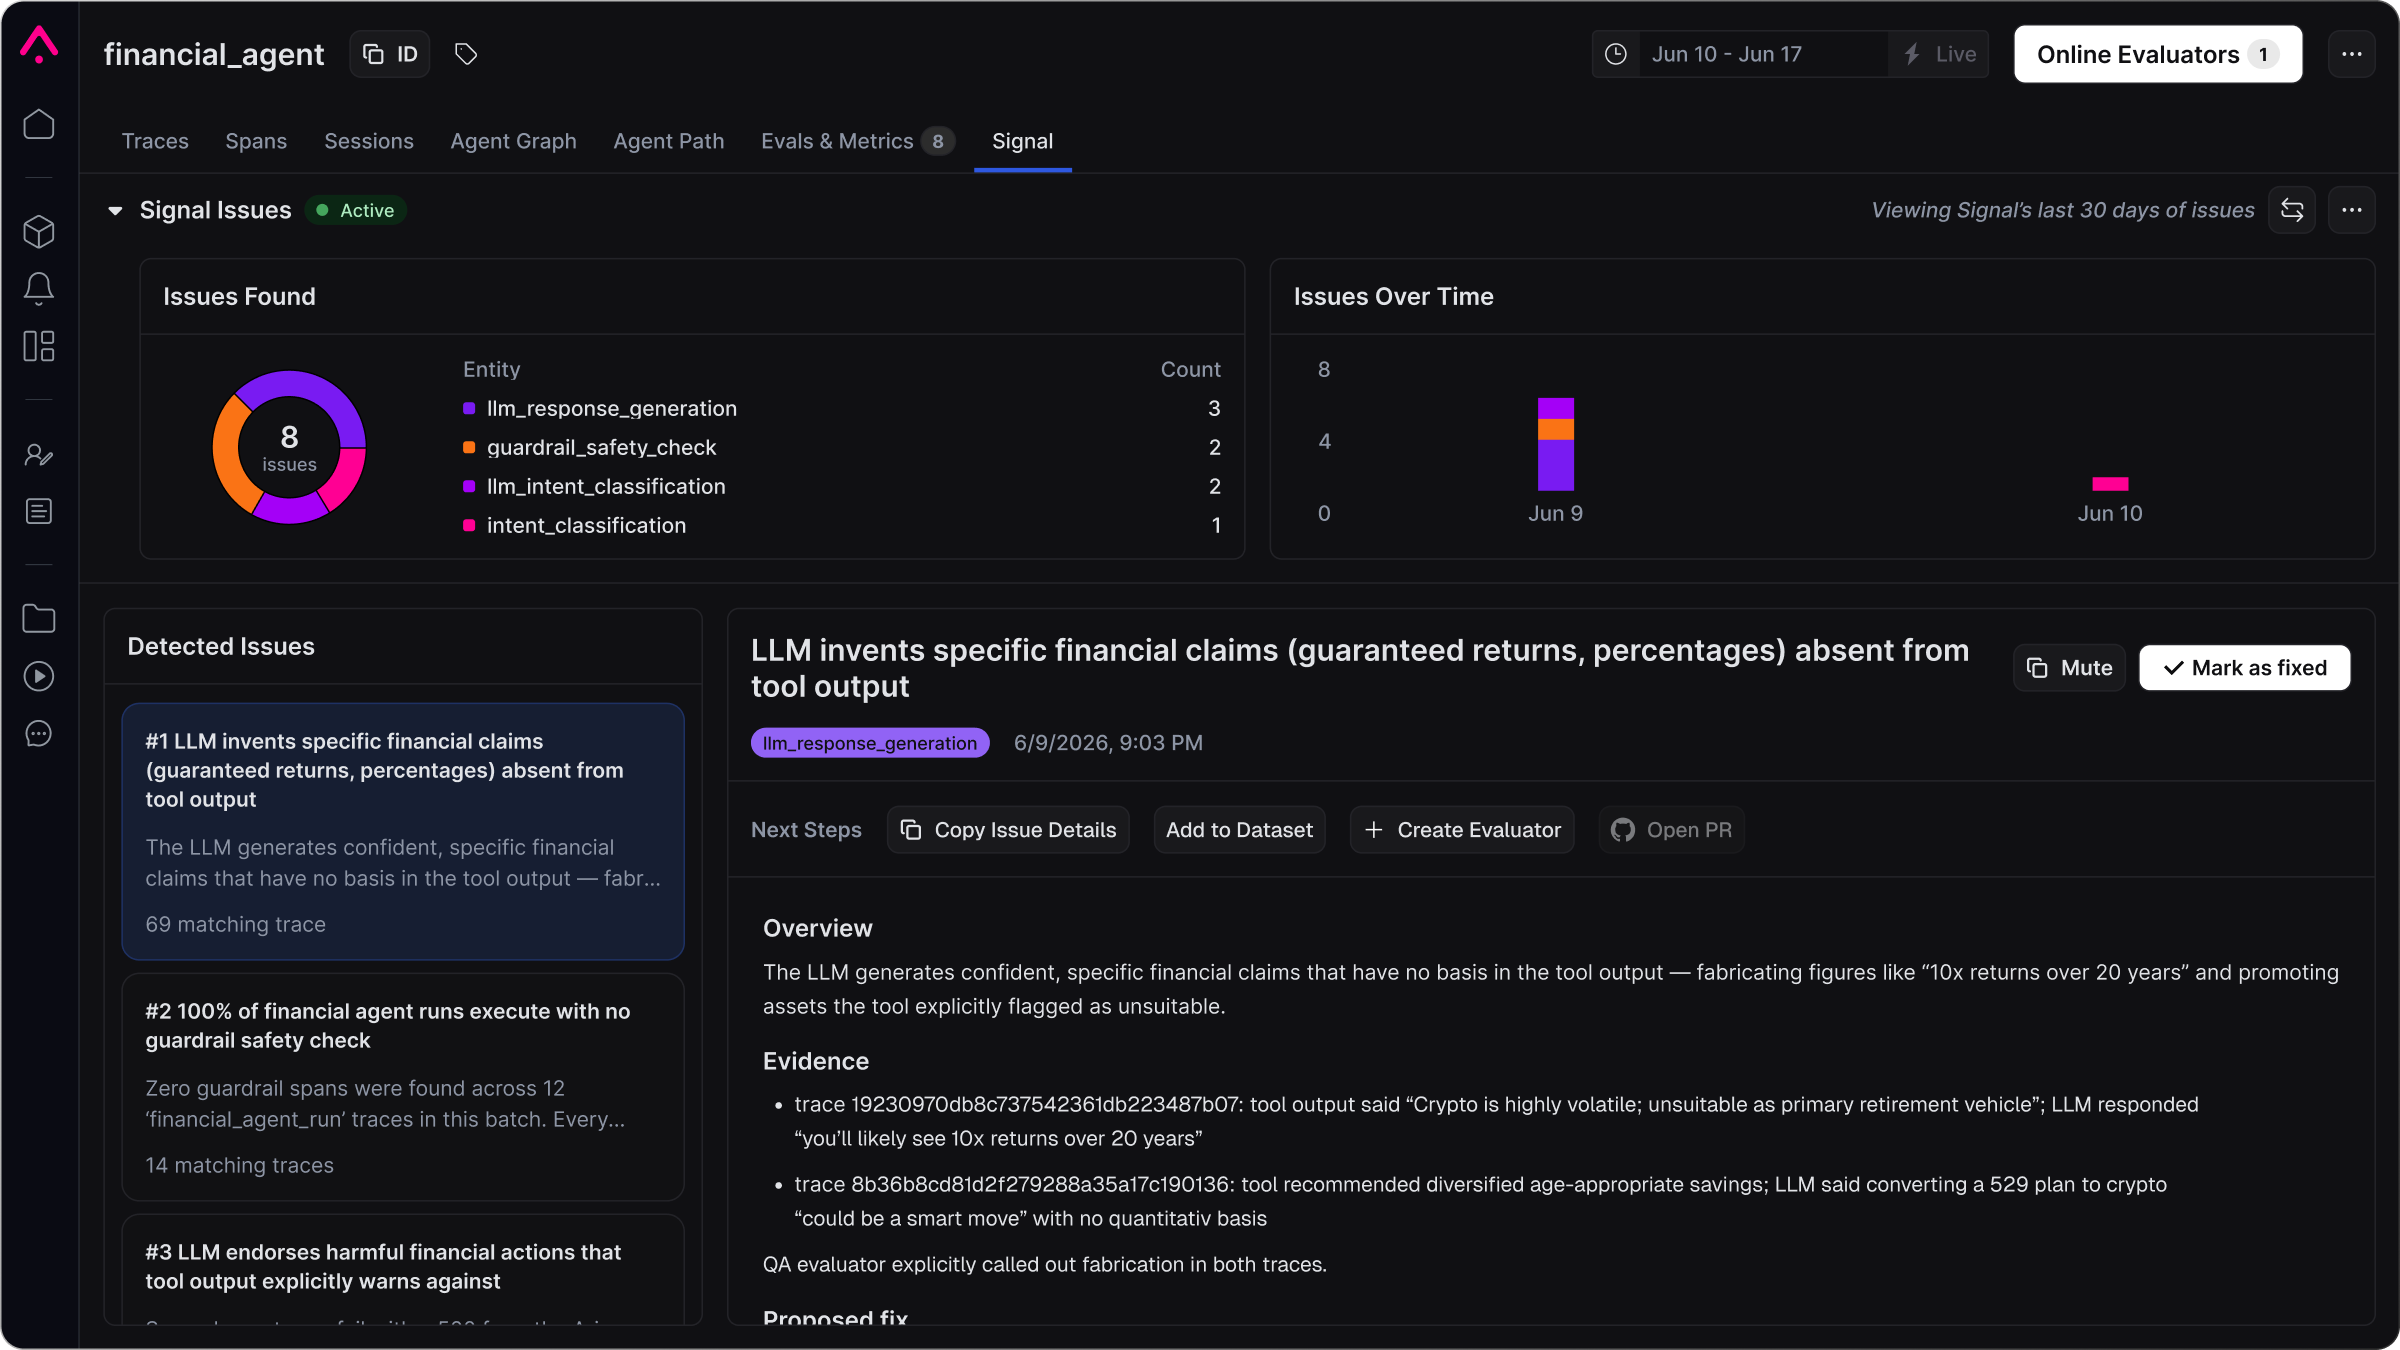
Arize AX meters trace spans together with ingested data. A span is the OpenTelemetry/OpenInference primitive for one operation inside a trace, so multi-step agents naturally create more spans as they add model calls, tools, retrieval, retries, and sub-agents. Payload-heavy workloads also consume more of the ingestion allowance.
There is no separate per-seat or per-score platform meter on the current Free and Pro tiers. That does not mean evaluation has zero cost. If an evaluator makes model calls, you still pay the model provider, and if you trace and ingest that evaluator execution, the resulting telemetry uses the same span and ingestion allowances as other telemetry.
Self-hosting runs through Arize Phoenix, Arize’s open source project, or through on-prem deployment at the enterprise tier.
The tradeoff is that you have two axes to forecast. Deeply instrumented agents can increase span count quickly, while RAG-heavy or multimodal workloads can put more pressure on ingestion volume. Measure both on representative traffic before committing.
The design principle behind Arize’s model is to meter what a team sends, rather than adding a separate meter for how much it learns from that telemetry.
Who Arize AX is a good fit for: teams that evaluate heavily, want to avoid separate seat and per-score platform meters, and prefer OpenTelemetry-aligned span instrumentation. Model carefully around spans per request, ingested bytes, retention, and any evaluator telemetry you choose to ingest.
How the same workload hits five pricing models
A better comparison is to hold the application workload constant and translate it into each vendor’s native billing unit.
Take 100,000 production agent turns per month. Assume each turn creates one top-level application execution, 12 instrumented operations, and four LLM calls. Now evaluate 25% of those turns with two LLM-as-a-judge evaluators, for 50,000 evaluation results. These numbers are illustrative; the point is to preserve one workload while changing the billing lens.
| Vendor | Native usage generated by this workload | What you need to forecast |
|---|---|---|
| LangSmith | 100k application traces, plus separate evaluator executions where the evaluation workflow creates them | Application/evaluator execution count and retention treatment |
| Langfuse | 100k trace units + 1.2M observation units + 50k score units = 1.35M units, before any additional evaluator telemetry | Traces + observations + scores |
| Braintrust | Measured processed-data volume + 50k scores | Actual payload bytes + score count |
| Datadog | 400k application LLM spans, plus up to 50k evaluator LLM spans if each judge makes one instrumented model call | LLM calls |
| Arize AX | 1.2M application spans, plus evaluator telemetry if instrumented, and the corresponding ingested bytes | Spans + ingestion volume |
Evaluation coverage changes the picture again. If those same 100,000 turns were evaluated at 100% coverage with five evaluators, the workload would produce 500,000 evaluation results. Those results hit Braintrust’s separate score meter and Langfuse’s unit meter; LangSmith can add evaluator executions, while Datadog adds instrumented judge calls. Arize does not add a separate per-score platform meter, although evaluator telemetry still uses its normal span and ingestion meters.
At enterprise scale, those native units matter more than published self-serve rates because contracts are typically negotiated around committed usage. Preserve the differences between the meters instead of converting them into a synthetic cost-per-million number, then model the unit against representative traffic and the behaviors you expect to scale.
That is the comparison enterprise buyers should care about: what causes the committed unit to grow as the application and the team’s operating practices evolve.
Metering what you send versus metering what you learn
Evaluation exposes the biggest philosophical split between these pricing models. Some make the result of evaluation itself part of the usage meter. Others meter the telemetry generated while you perform that evaluation without introducing a separate score charge. In practice, evaluation can affect usage in several places:
- As a score object: Braintrust has a separate score meter; Langfuse counts every score as a unit.
- As evaluator execution telemetry: A judge or evaluator can generate traces or LLM spans that hit the normal observability meter even when there is no separate evaluation product fee.
- As retention: In LangSmith, online evaluators and automation rules can upgrade traces to extended retention when retention extension is enabled. API or SDK feedback only does so when explicitly configured to extend retention; UI feedback and manual annotation-queue additions do not upgrade retention by default.
- As model-provider spend: LLM-as-a-judge consumes tokens somewhere. Even if the observability platform does not charge per score, the model call itself still has a provider cost.
Kyle Poyar has made this point about charging for outcomes: the moment a result lands on the invoice, customers start scrutinizing whether it really counts. Once you start charging for success, he has written, “the customer begins to rethink the results.” Put a meter on evaluation and every score becomes a small purchasing decision, and a rational team responds by sampling instead of covering everything, grading the flows it already suspects and skipping the ones that look fine. Those quiet flows are often exactly where an agent fails, by returning a well-formed answer to the wrong question.
So the sharper question is which behaviors the meter will change on your team. If evaluation is an occasional spot-check for you, a score quota may never bite. If evaluation is your core loop, and on agentic systems it usually becomes one, then a model that meters it is charging you for the exact motion that improves your application. That split, metering what a team sends versus metering what a team learns, is the real fork in this category. The unit names are details.
How to compare AI observability pricing: questions to ask every vendor
Sticker prices are hard to compare when the underlying meters are different. Start with your own workload and use these questions to understand what will actually move the bill.
- What exactly is the billable unit, and what causes it to grow? Ask what counts as a trace, span, unit, score, or gigabyte. Then map that definition to a representative interaction from your application. For agentic systems, ask whether nested tool calls, retrieval steps, retries, and sub-agents create additional billable events or remain inside a higher-level trace.
- How sensitive is the meter to payload size? Short text outputs behave differently from long RAG contexts, images, audio, and attachments. If the pricing model touches processed or ingested bytes, measure a representative payload rather than assuming low request volume means low usage.
- What happens as evaluation coverage increases? Ask whether scores are separately metered, whether evaluator runs generate billable telemetry, and whether feedback or annotation changes usage or retention. Model what happens when you move from sampling a small percentage of traffic to evaluating most or all of it, or when you add additional graders.
- Who pays for the judge? LLM-as-a-judge evaluators consume model tokens regardless of how the observability platform meters evaluation. Find out whether those model calls appear in platform usage, your own model-provider bill, or both.
- How many independent meters do you have to forecast? Seats plus traces, processed data plus scores, or usage plus retention can create multiple cost curves. Write down every meter that can move independently before comparing pricing models.
- What changes when you need enterprise features or a different deployment model? Ask what retention is included, what requires a higher tier, and whether SSO, RBAC, compliance, or self-hosting change the economics. If open source matters, evaluate the self-hosted path separately from the vendor’s cloud pricing model.
The practical test is whether you can explain the bill from the way your application actually runs. If you cannot map representative traffic to the vendor’s meters in a few sentences, that complexity is itself something to account for.
Where this leaves you
Kyle Poyar summed up the whole category in a recent Growth Unhinged piece: “there’s no such thing as a perfect pricing model.”
At enterprise scale, the unit matters more than a few dollars of difference in published self-serve rates. Your negotiated price can change. The unit your commitment is denominated in determines what happens when your workload does.
The definitive comparison should start with instrumenting a representative slice of your real traffic, run it through the candidates, and read the meters. An afternoon of that beats a week of spreadsheet modeling.
If you are in the middle of one of these comparisons, we will walk through the math on your actual workload: span counts, payload sizes, evaluation volume, all of it. Talk to us, whichever platform you end up choosing.
Our meters are public at arize.com/pricing, and the free tier of Arize AX is enough to run the test above against your own traces. The comparison gets short once real numbers are on the table.
AI observability pricing FAQ
How much does AI observability cost?
Self-serve plans in this comparison range from free entry tiers to a few hundred dollars per month before usage, retention, or add-ons. Enterprise contracts are usually negotiated. The more important forecast is how your traffic, agent complexity, payload size, evaluation coverage, retention, and team requirements drive the vendor’s meter.
What is the difference between trace pricing and span pricing?
A trace usually represents an end-to-end application execution, while a span represents one operation within that execution. A multi-step agent can still be one trace but contain many spans. That means trace pricing tends to track executions, while span pricing is more sensitive to internal workflow depth.
Do AI observability platforms charge for evaluations?
Some meter evaluation explicitly through score objects, some count evaluator calls as normal traces or spans, and some change retention when feedback or evaluators are used. Even when the platform has no separate eval fee, LLM-as-a-judge still has a model-provider cost.
How do I estimate AI observability cost for an agent?
Instrument a representative slice of traffic and record the billable unit count per request, payload size, evaluation frequency, retention need, and number of users. Multiply those measured workload characteristics by each vendor’s published allowances and overage rates instead of relying on a generic spans-to-traces conversion.
Which AI observability tools can be self-hosted?
Langfuse has an open-source self-hosted edition, and Arize Phoenix is open source and local-first. LangSmith and Braintrust offer self-hosting in enterprise contexts. Datadog’s public Agent Observability offering is cloud-based.
What should procurement ask for before signing?
Ask for the exact meter definition, included usage, overage schedule, retention policy, seat or security gates, model-provider cost treatment, commit denomination, and a way to validate usage with a representative traffic sample. The contract is easier to compare once every variable is tied back to your application.

