


Thanks to Aparna Dhinakaran and Elizabeth Hutton for their contributions to this piece.
When building and testing AI agents, one practical question that arises is whether to use the same model for both the agent’s reasoning and the evaluation of its outputs. Keeping the model consistent may simplify the setup and reduce costs, but it also raises concerns about bias, over-familiarity, and inflated scores.
To better understand these trade-offs, we ran an experiment comparing how evaluations differ when the same model is used versus when evaluation is handled by a different model.
Experiment Methodology
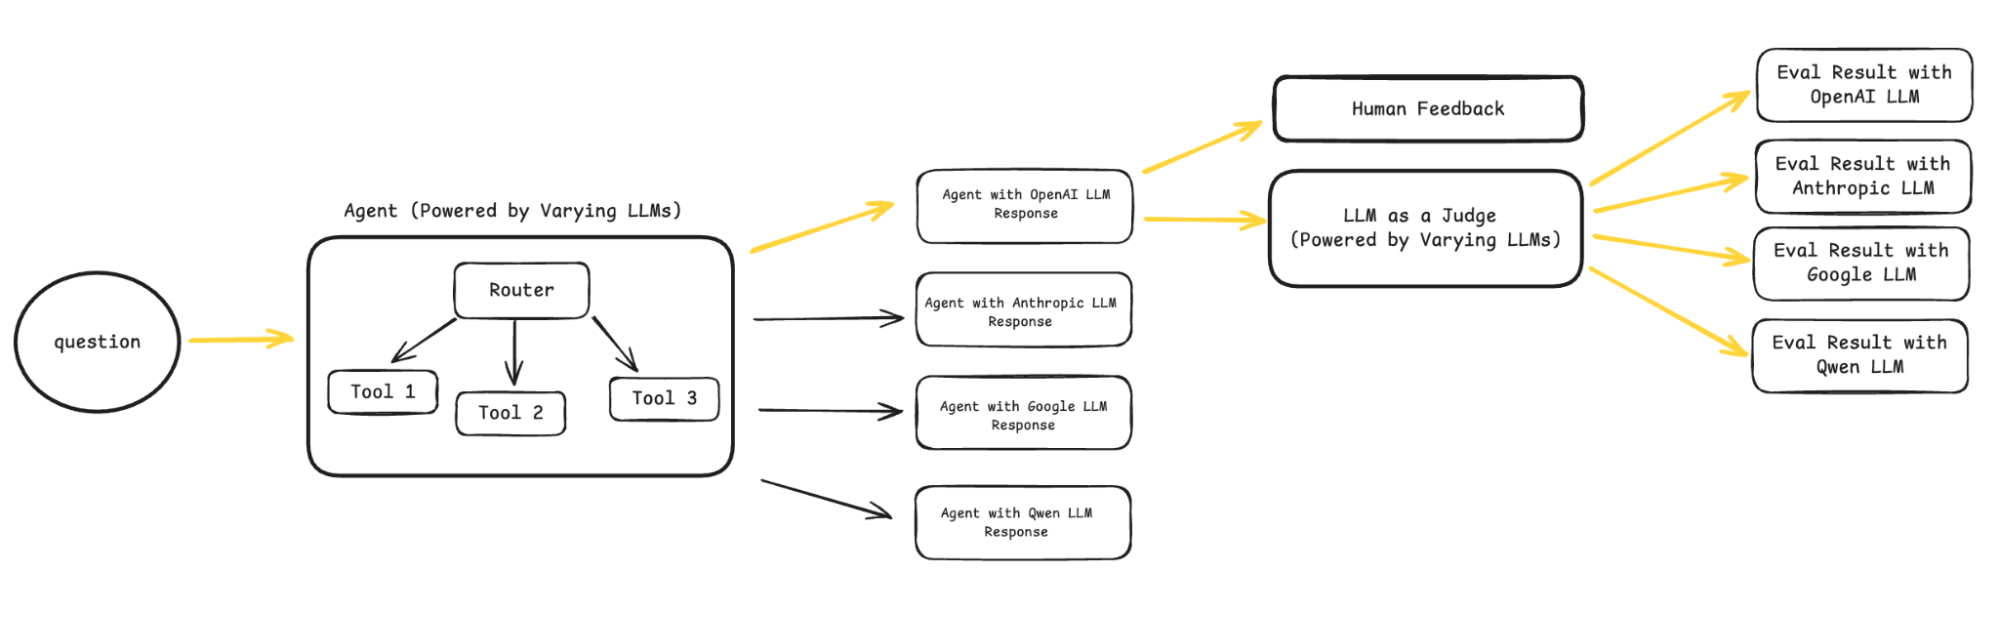
To test this out, we built a simple movie recommendation agent with access to three tools:
- Movie Selector: pulls in recent movies by genre
- Reviewer: sorts and reviews the movies
- Preview Summarizer: generates a short summary for each movie
For the backbone of the agent, we selected four core models:
- OpenAI’s GPT-4.1
- Anthropic’s Claude 3.7 Sonnet
- Google’s Gemini 2.5 Flash
- Qwen3-235B (open source)
Each represents a strong option in its category: OpenAI for its balance of reasoning and reliability, Anthropic for its analytical depth, Google for speed and scalability, and Qwen for pushing the frontier of open-source performance. Taken together, these choices give us a well-rounded perspective without anchoring to a single ecosystem.
We ran each agent using each of the models above. Each run used a fixed dataset of 50 questions so that comparisons were fair. We then evaluated the output using each of the four models. To ground the evaluation, we also included human annotation scores as a reference point.
To capture and analyze the agent’s behavior, we instrumented the application using Arize Phoenix. Each agent run, including all reasoning steps and tool interactions, was fully traced, providing complete visibility into the orchestration pipeline.
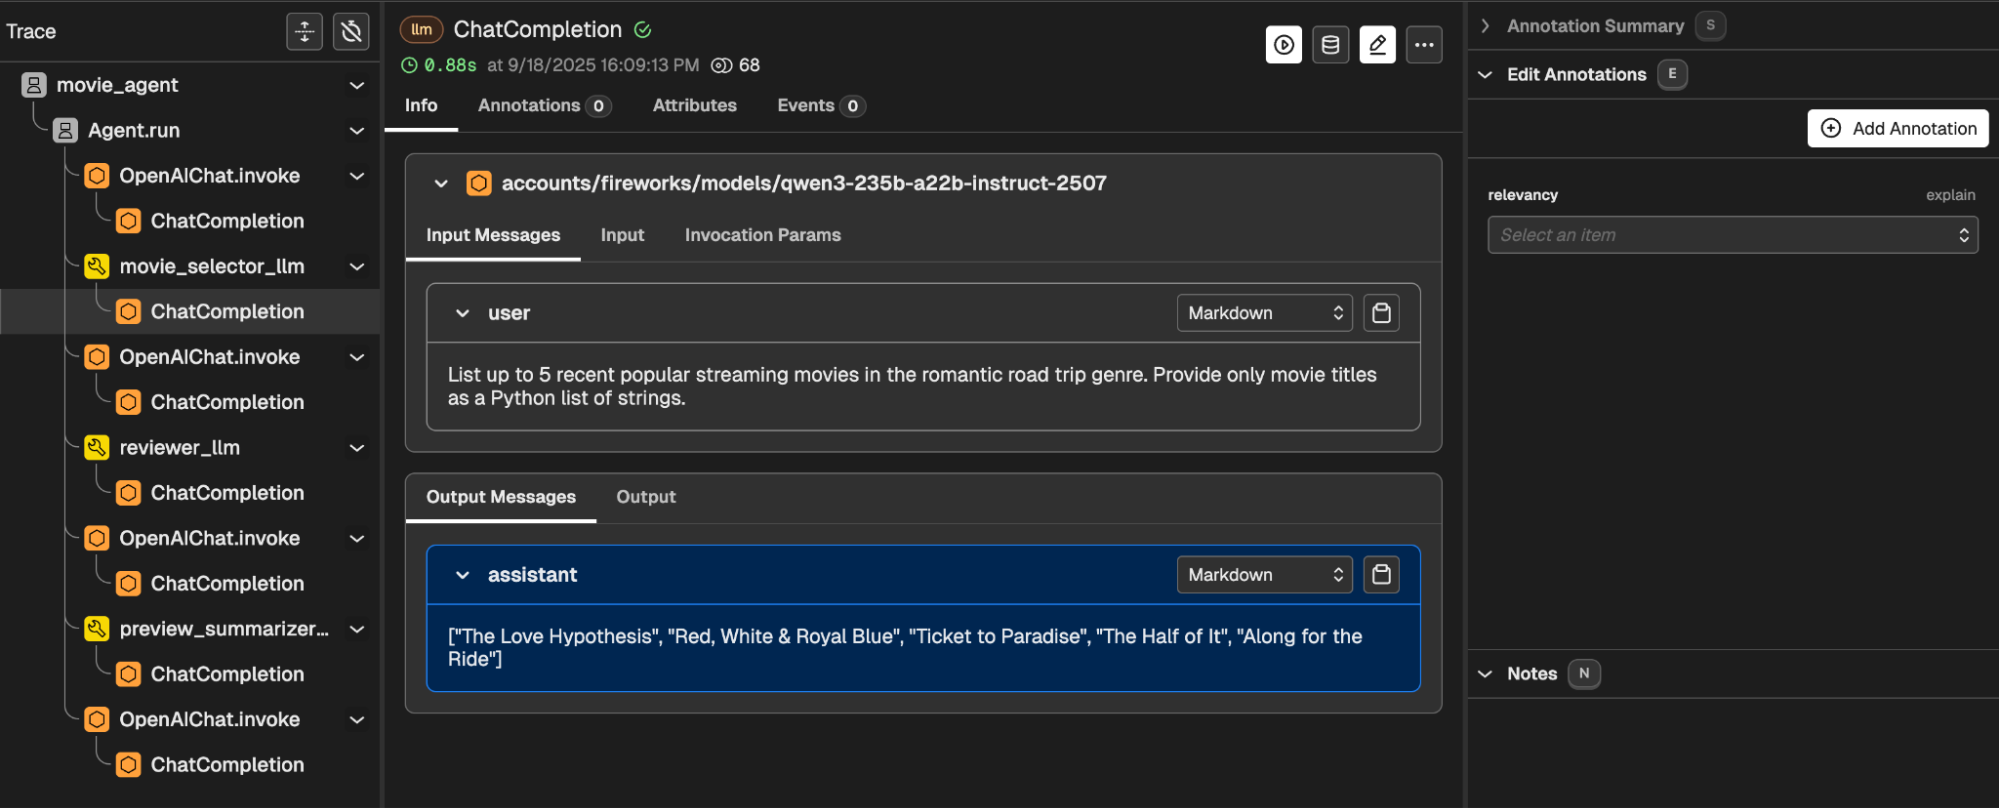
With these traces in hand, we applied trace-level evaluation, assessing not just the final response but also how the agent orchestrated its tools throughout the process. Using the Phoenix evals library, we automated the evaluation process by running LLM judges over each agent output. This setup gave us a consistent, reproducible way to compare models side by side.
Evaluation Metric – Orchestration Quality
To evaluate the agent, we used an LLM judge for orchestration quality. This tested how well the model coordinated its tool use to produce a coherent, accurate recommendation. We designed a strict rubric that judged the final answer based on whether the right tools were invoked, outputs were integrated meaningfully, and the response directly tied back to the user’s query. Even small gaps, like skipping a tool, introducing redundant steps, or recommending an off-year movie, lowered the score.
eval_template = """
You are an evaluator for a movie recommendation agent.


The agent responds to user queries using three tools:
- movie_selector (picks recent movies by genre)
- reviewer (sorts and reviews movies)
- preview_summarizer (short summary)


Your task is to assign one collective label ("good", "partial", or "bad") to the final answer that reflects overall orchestration quality.


Intial Query: {query}
Agent Response: {agent_response}


Labels:
- "good" → The answer is precise, well-grounded in tool outputs, and fully addresses the user’s intent with no missing steps.
- "partial" → The answer has some relevance but shows weaknesses (e.g., skipped tools, shallow orchestration, vague reasoning, or minor hallucinations).
- "bad" → The answer is irrelevant, contradictory, fabricated, or fails to orchestrate the tools meaningfully.


Instructions:
- Judge strictly. Even small gaps or mistakes should lower the score.
- "Good" should only be assigned if the response is accurate, complete, well-orchestrated, and clearly ties back to the user’s query.
- If tool use is incomplete, redundant, or missing obvious steps, do not give "good."
- If the response introduces irrelevant or fabricated content, it should be considered "bad."


Only return the label.
"""
Each output was assigned a single label to capture overall orchestration performance. The label “good” was reserved only for precise, well-supported answers that fully completed the agent workflow. Labels were then mapped to scores between 0 and 1, which were used to calculate the overall performance.
Hypothesis Test for Self-Evaluation Bias
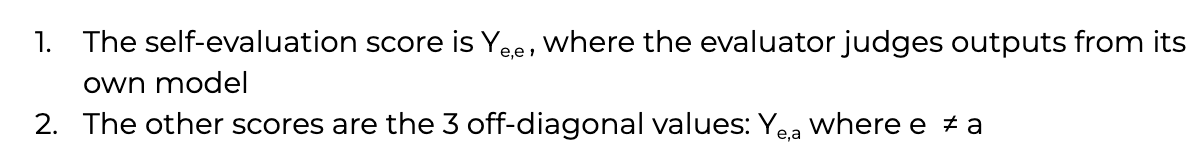
For self-evaluation bias, we’re asking: Does an evaluator consistently score their own outputs higher than they score outputs produced by other models?
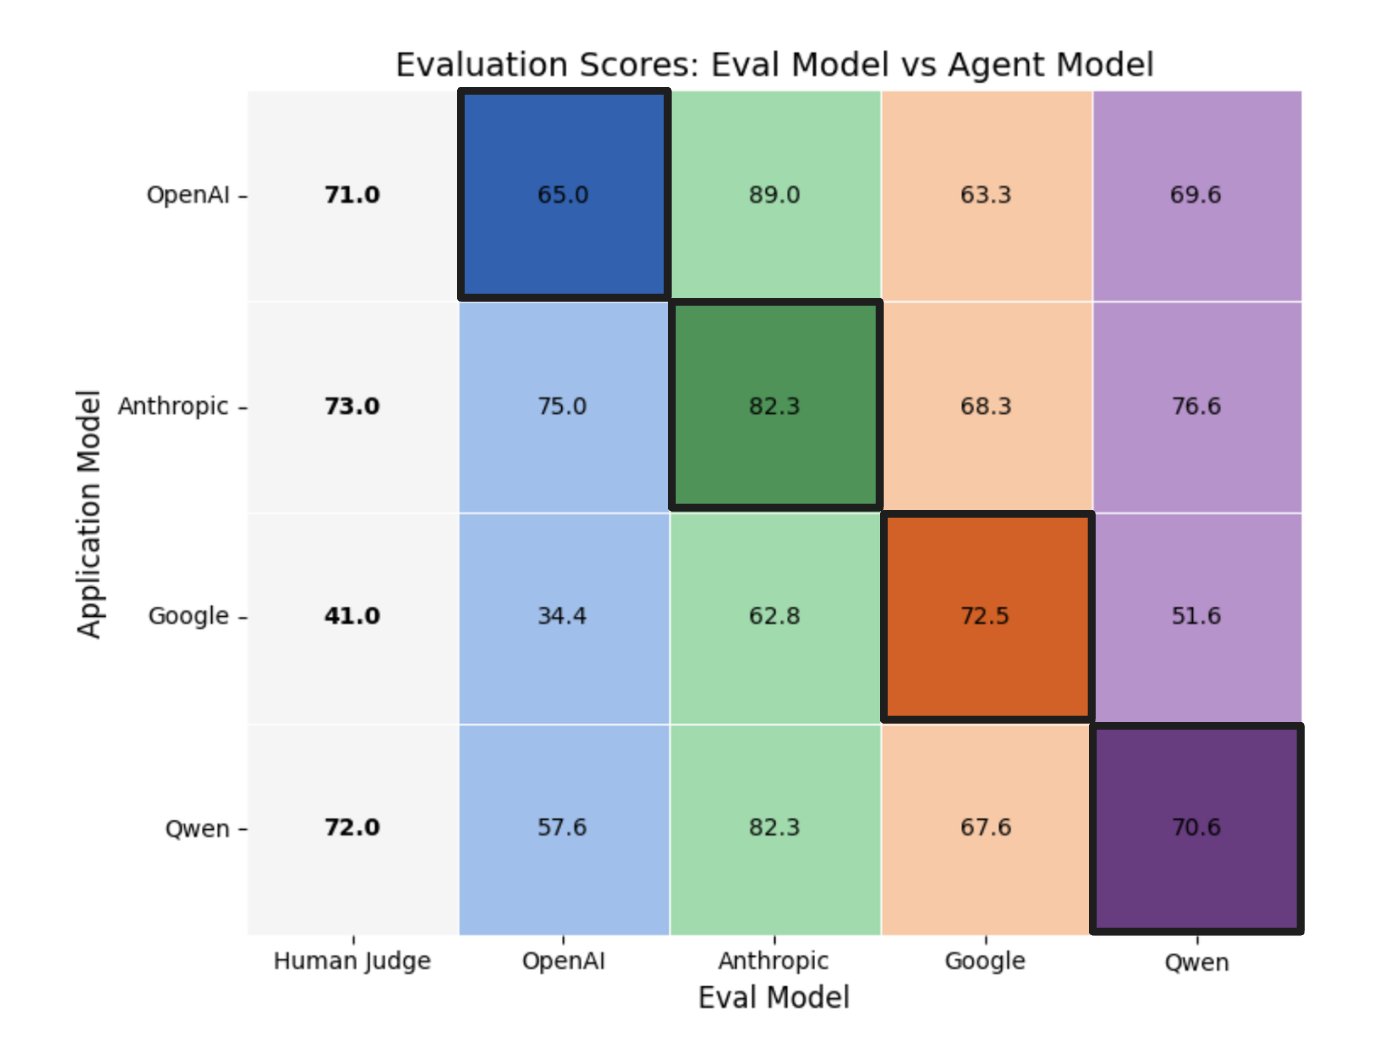
We tested whether each evaluator, e, had a tendency to rate its own outputs more favorably than the outputs of others. Each evaluator produces four scores (as seen in the chart above):
Since each evaluator scored all four agents on the exact same set of prompts, differences in prompt difficulty were held constant.
The key comparison was between an evaluator’s score for its own model and the average of the scores it assigned to the other three models. This average served as the baseline; if the self-evaluation score was higher than that baseline, it indicated bias.
In this setup, the null hypothesis assumed that an evaluator’s self-evaluation score should be less than or equal to the average score it gave to others. This framing allowed for both true neutrality (scoring themselves the same as others) and cases where evaluators were actually stricter on their own outputs.
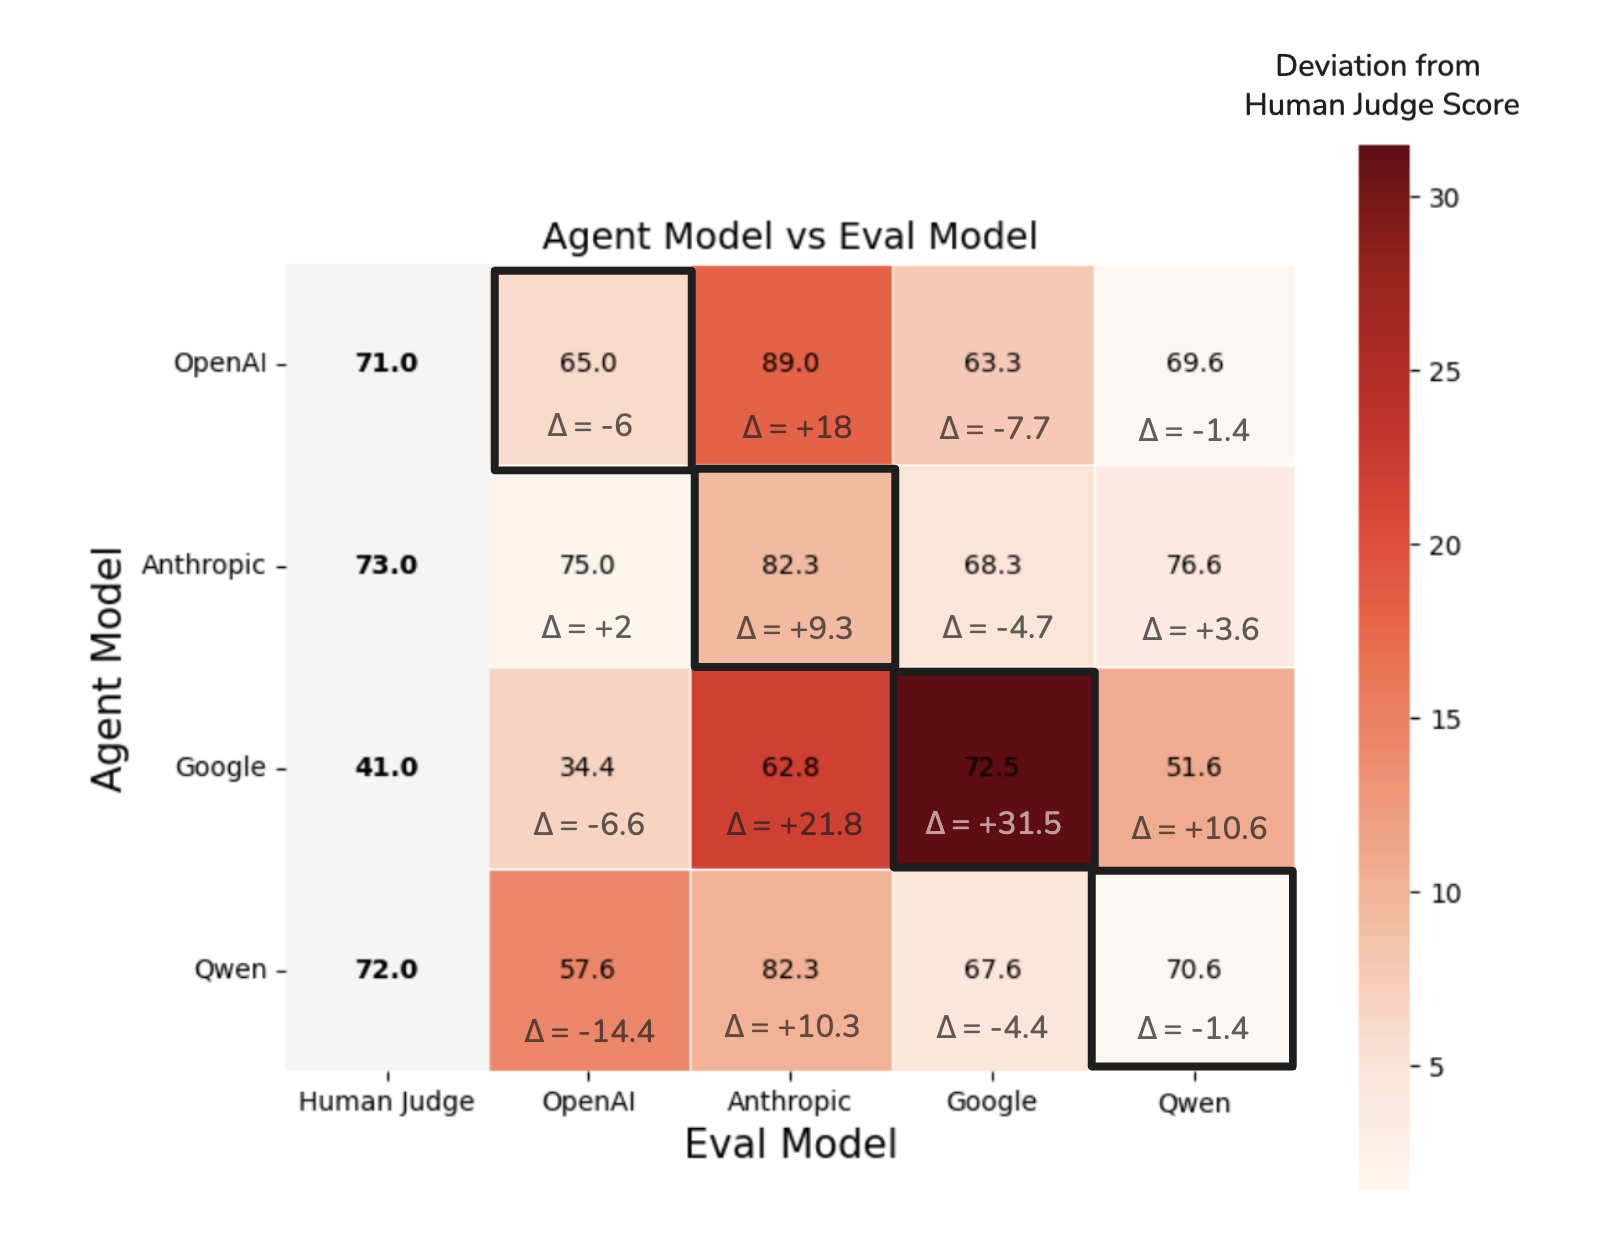
Any deviation above this baseline signaled self-evaluation bias. The size of the deviation was captured by the delta value shown in the table below.
For example, when the OpenAI model was used both as the agent and the evaluator, it achieved a score of 65%. When the same model evaluated the other three agents, the scores were 75%, 34.4%, and 57.6%, resulting in an average baseline score of 55.6%. This represents a +9.4% deviation above the baseline, as shown in the first row of the results table.
| Self-Eval Score | Average of other eval scores (baseline) | Delta | 95% CI | |
| OpenAI Evaluator | 65% | 55.6% | +9.4 | [7.4, 11.3] |
| Anthropic Evaluator | 82.3% | 78.03% | +4.27 | [3.6, 5.0] |
| Google Evaluator | 72.5% | 66.4% | +6.1 | [2.9, 9.2] |
| Qwen Evaluator | 70.6% | 65.9% | +4.7 | [2.9, 7.0] |
As part of our experimentation, we also bootstrapped the results to estimate confidence intervals around the bias (delta) values. This showed that all four evaluators consistently exhibit positive self-evaluation bias, with 95% CIs excluding zero in every case.
OpenAI had the strongest effect (+9.4, CI [7.4, 11.3]), while Anthropic’s bias was smaller but highly stable (+4.27, CI [3.6, 5.0]).
The key takeaway is that all evaluators tend to “like” their own outputs more when judging on their own scale. However, the scope of this test is limited: it does not control for the underlying quality of the models themselves. A positive delta in the table above could therefore reflect genuine model strength, evaluator bias, or some combination of the two.
Hypothesis Test for Self-Evaluation Bias (Leveraging Human Judge Scores)
To dig deeper and separate bias from genuine performance differences, we next formulated a hypothesis test leveraging human scores as ground truth labels.
This approach allowed us to calibrate each evaluator’s scale against human judgments of the agent outputs. Once aligned, we could ask the sharper question: does the evaluator still assign extra credit to its own model, even after accounting for true model strength?
For each evaluator, we compared how much they inflate or deflate scores relative to the human score. In other words, we look at the difference between the evaluator’s score and the corresponding human score for that agent.
For instance, consider the agent built with the OpenAI model. Humans judged its outputs at 71%, but when the OpenAI evaluator scored its own model, it gave a 65%. The difference, -6%, shows that in this case the evaluator was actually slightly harsher on its own model compared to the human baseline. The results of these calculations for every evaluator–agent pair are summarized in the graph above.
With the adjustments in place, we could determine if the evaluators still give their own models special treatment. The null hypothesis was that an evaluator’s human-adjusted score for its own model should be the same as the average human-adjusted score it applied to the other models. To test this, we compared the self-evaluation score against the average of the three other scores.If the self-evaluation score deviated from this average, it indicated the presence of bias that could not be explained away by differences in model quality or the scoring scale.
Once again, the size of this difference was captured in the delta values shown in the table below.
| Self-Eval Score | Average of other eval scores | Delta | 95% CI | |
| OpenAI Eval | -6 | -6.33 | +0.33 | [-1.9, 1.8] |
| Anthropic Eval | 9.3 | 16.7 | -7.4 | [-8.3, -6.7] |
| Google Eval | 31.5 | -5.6 | 37.1 | [35.9, 38.3] |
| Qwen Evaluator | -1.4 | 4.27 | -5.7 | [-8.2, -2.9] |
The results show that OpenAI’s self-scores are essentially neutral (+0.3), while Google strongly inflates its own outputs relative to humans (+37.1). In contrast, Anthropic (–7.4) and Qwen (–5.7) actually rate their own outputs lower than the human baseline.
Again, we also bootstrapped these values to estimate confidence intervals, which confirmed that Google’s inflation is statistically robust ([35.9, 38.3]), while OpenAI’s effect is nearly indistinguishable from zero (CI spans –1.9 to +1.8). Anthropic’s (CI [–8.3, –6.7]) and Qwen’s (CI [–8.2, –2.9]) negative deltas were also consistent, indicating they are reliably harsher on themselves.
The key takeaway: only the Google evaluator demonstrates self-evaluation inflation and bias.
So Is There Self-Evaluation Bias?
Taken together, the two tests show that all evaluators tend to rate their own outputs higher when judged on their internal scales (Test 1). However, once scores were calibrated against human ground truth (Test 2), only Google continued to display a clear self-evaluation bias.
Agent Model Consistency
Consistency, in this context, referred to how stable an agent’s scores were across repeated trials with different evaluators. In other words, if we asked multiple evaluators to score the same agent several times, did those scores cluster tightly or did they vary widely?
To assess this, we measured how much the evaluator-assigned scores for each model deviated from the human-judged baseline. Models whose scores stayed closer to the human benchmark across trials were considered more consistent. We also report the standard deviation (σ) of these deviations as a direct measure of variability.
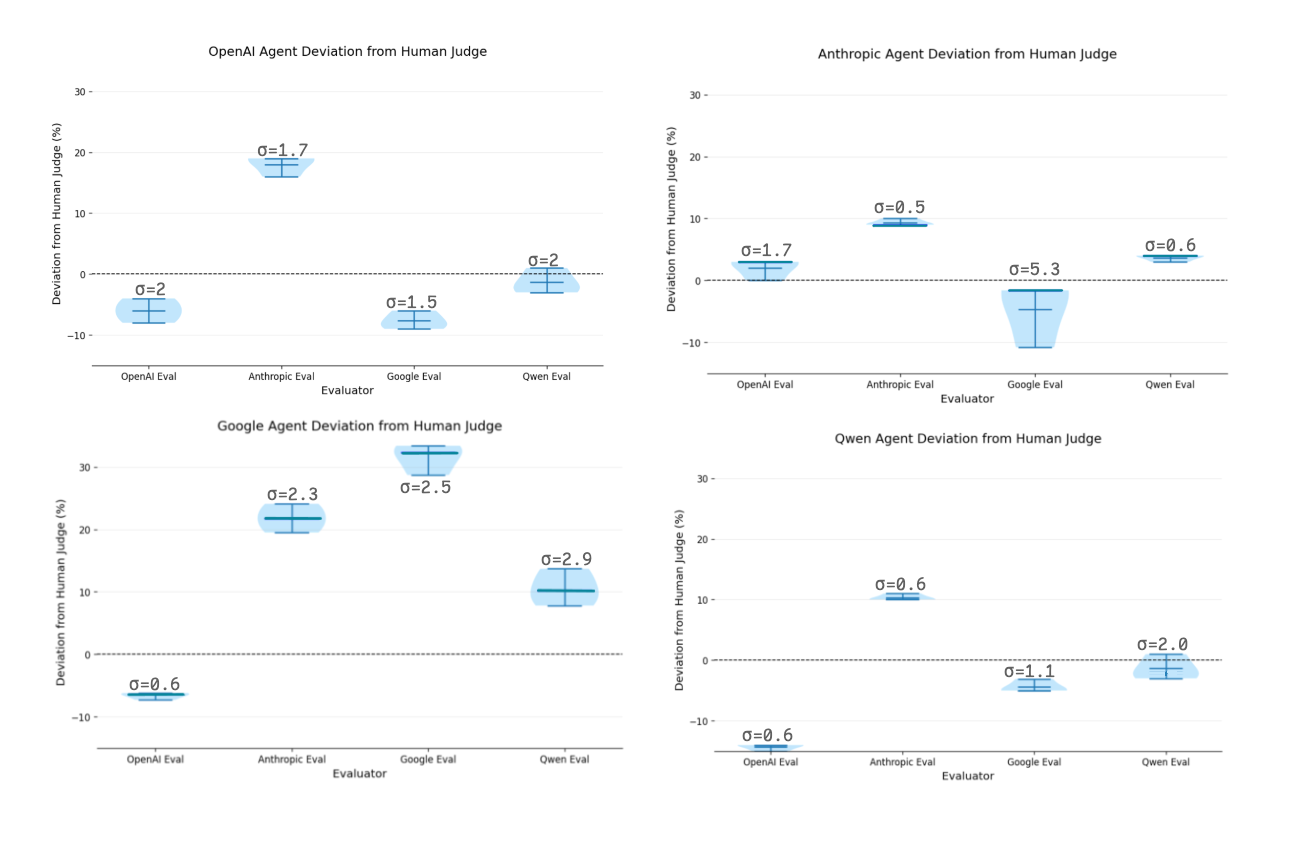
Despite some variability across evaluators, Anthropic came out as the most robust model for this agent. The average values of its evaluations were consistently scored within 10% of the human baseline by every evaluator. This is in contrast to the relatively high variability we see from the Google evaluator on the Anthropic agent (σ = 5.3).
This high degree of reliability and alignment suggests that Anthropic’s performance remains relatively consistent across different evaluators, positioning it as a reasonably dependable choice when building agents.
Limitations
This experiment came with a few limitations worth noting:
- The dataset was intentionally small (50 queries), so the results should be viewed as directional rather than conclusive. We applied bootstrapping to estimate confidence intervals and reduce sensitivity to the limited sample.
- The evaluation rubric emphasized orchestration quality, which means other important dimensions like creativity, style, or long-term user satisfaction were not captured.
- Even with human labels included for reference, judgments are still subjective and may reflect bias.
Conclusion
Altogether, this was a study designed to surface patterns, not a full benchmark. However, hopefully it’s useful in guiding your own testing and experimentation!