Configuring Annotations
To annotate data in the UI, you first will want to setup a rubric for how to annotate. Navigate toSettings and create annotation configs (e.g. a rubric) for your data. You can create various different types of annotations: Categorical, Continuous, and Freeform.
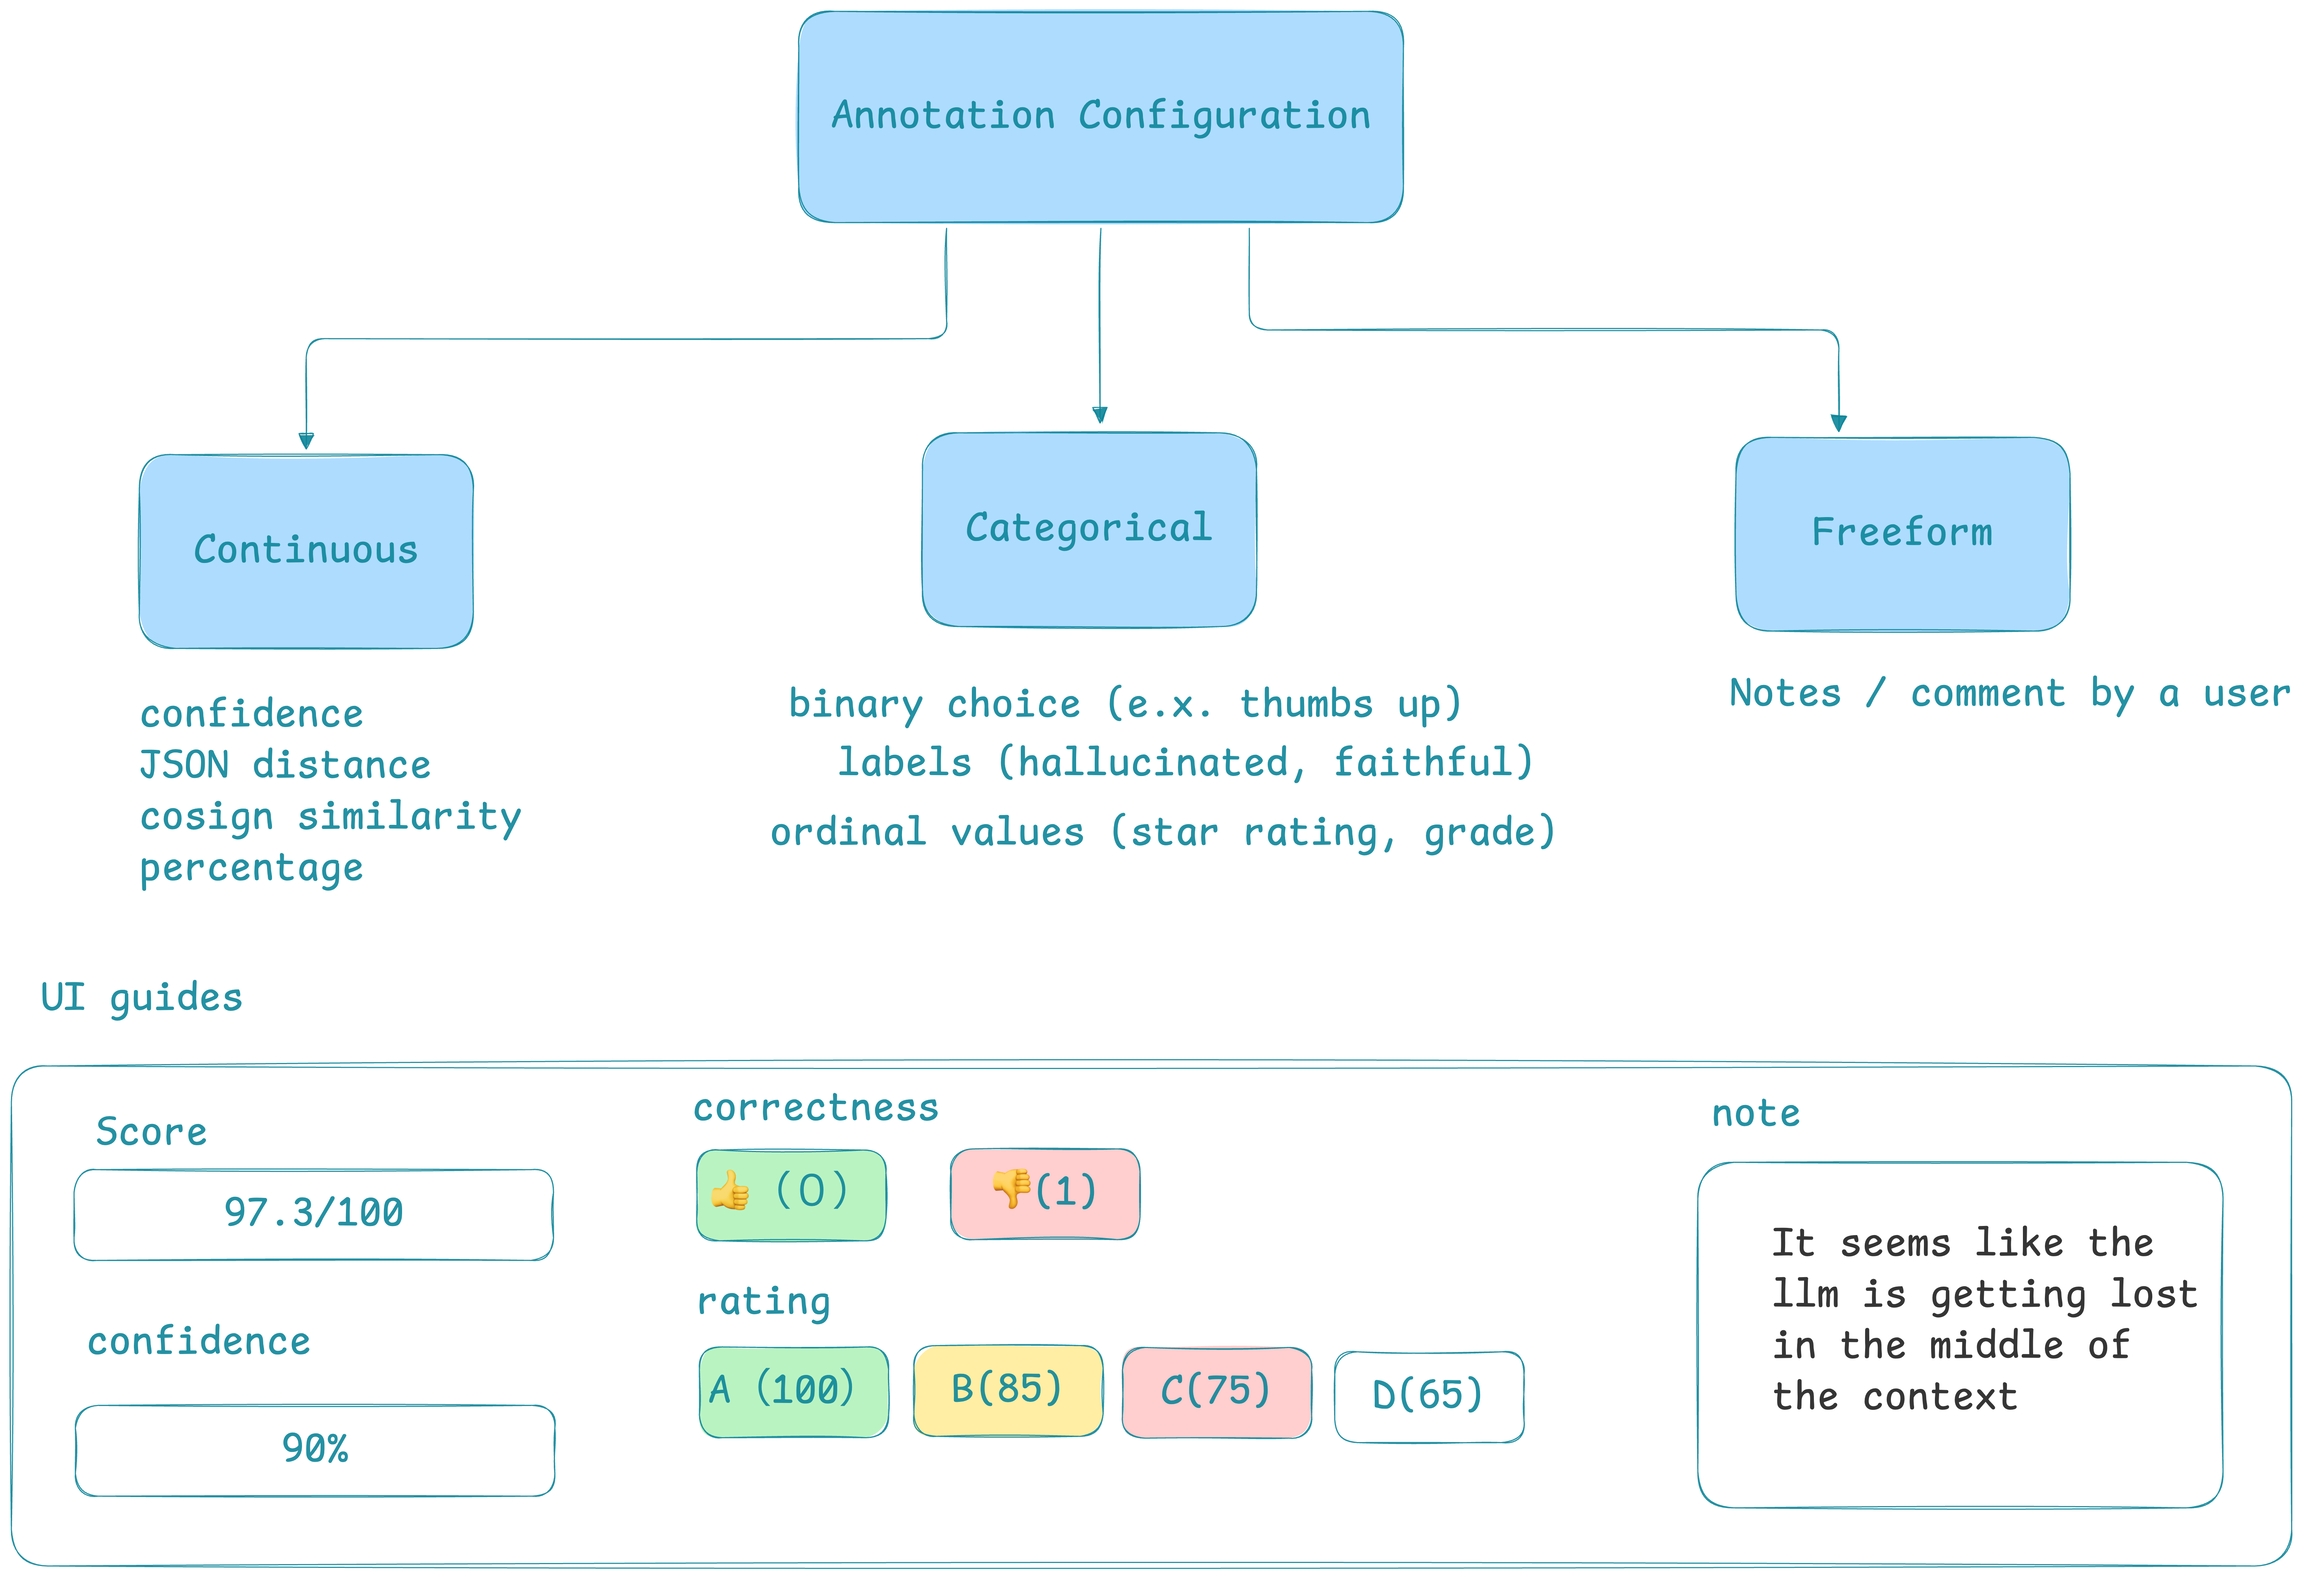
Annotation Types
Annotation Types
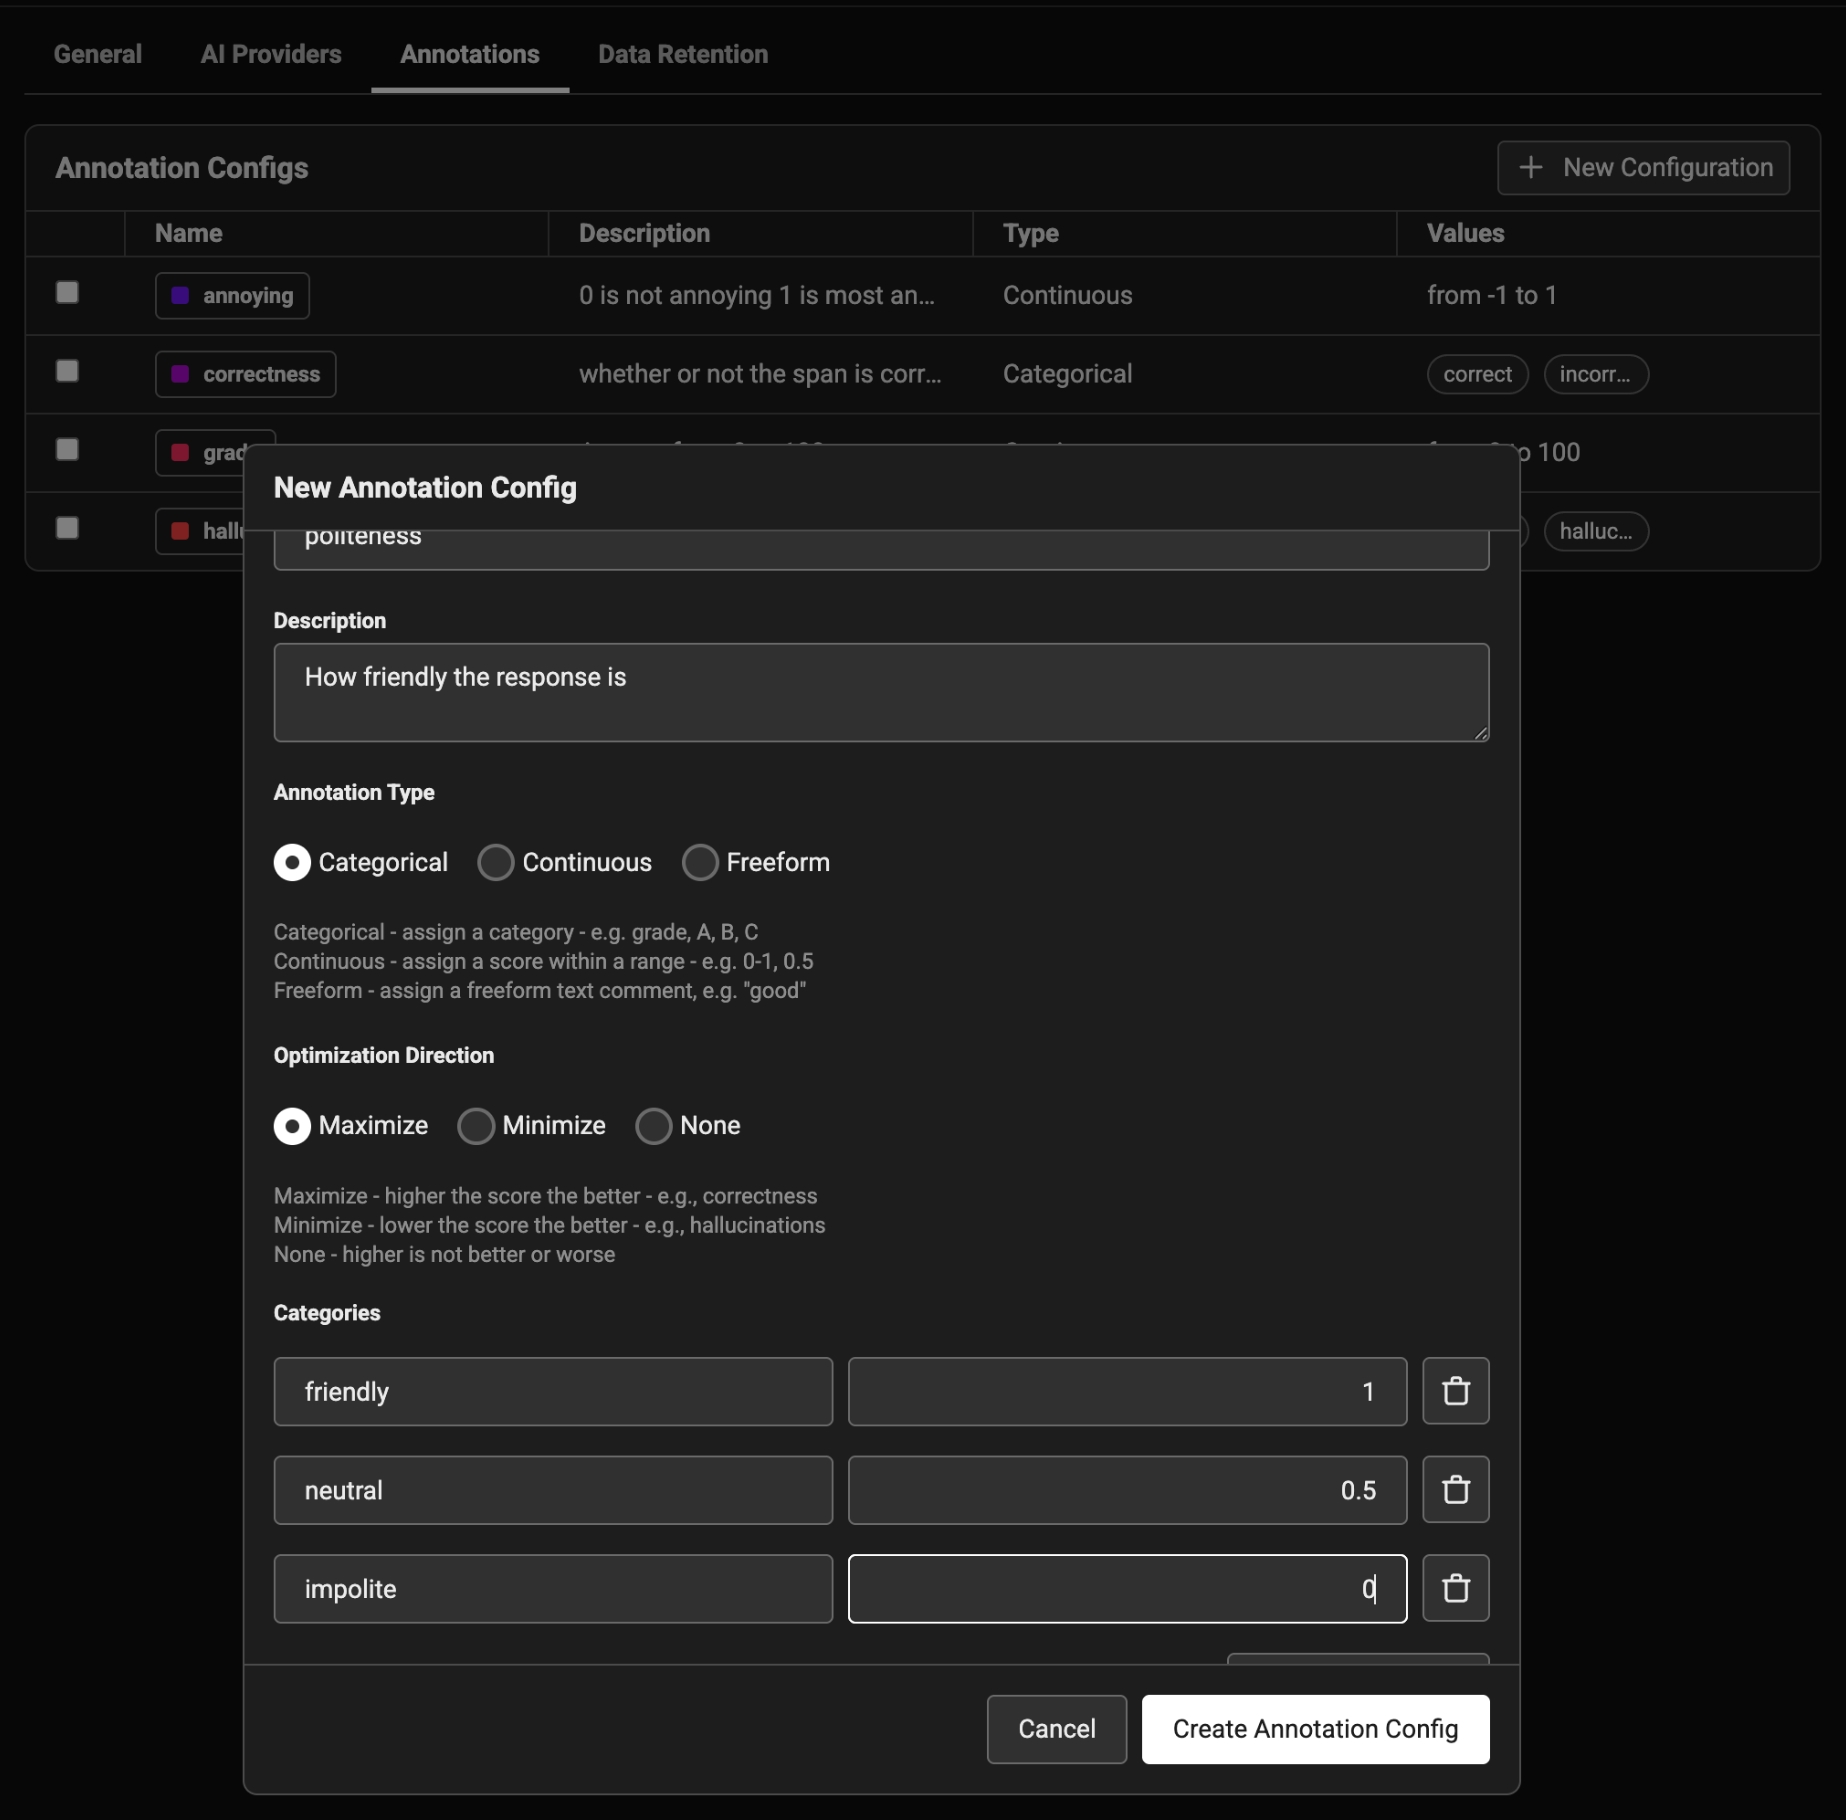
- Annotation Type:
- Categorical: Predefined labels for selection. (e.x. 👍 or 👎)
- Continuous: a score across a specified range. (e.g. confidence score 0-100)
- Freeform: Open-ended text comments. (e.g. “correct”)
- Optimize the direction based on your goal:
- Maximize: higher scores are better. (e.g. confidence, faithfulness)
- Minimize: lower scores are better. (e.g. toxicity)
- None: direction optimization does not apply. (e.g. refusal)
Different types of annotations change the way human annotators provide feedback
Configure an annotation to guide how a user should input an annotation
Every Phoenix instance ships with a built-in
user_feedback annotation config — a Categorical config with positive (score 1.0) and negative (score 0.0) labels. It is seeded automatically on startup and backs the thumbs-up / thumbs-down feedback in the assistant, so it will already appear when you list annotation configs on a fresh deployment.Adding Annotations
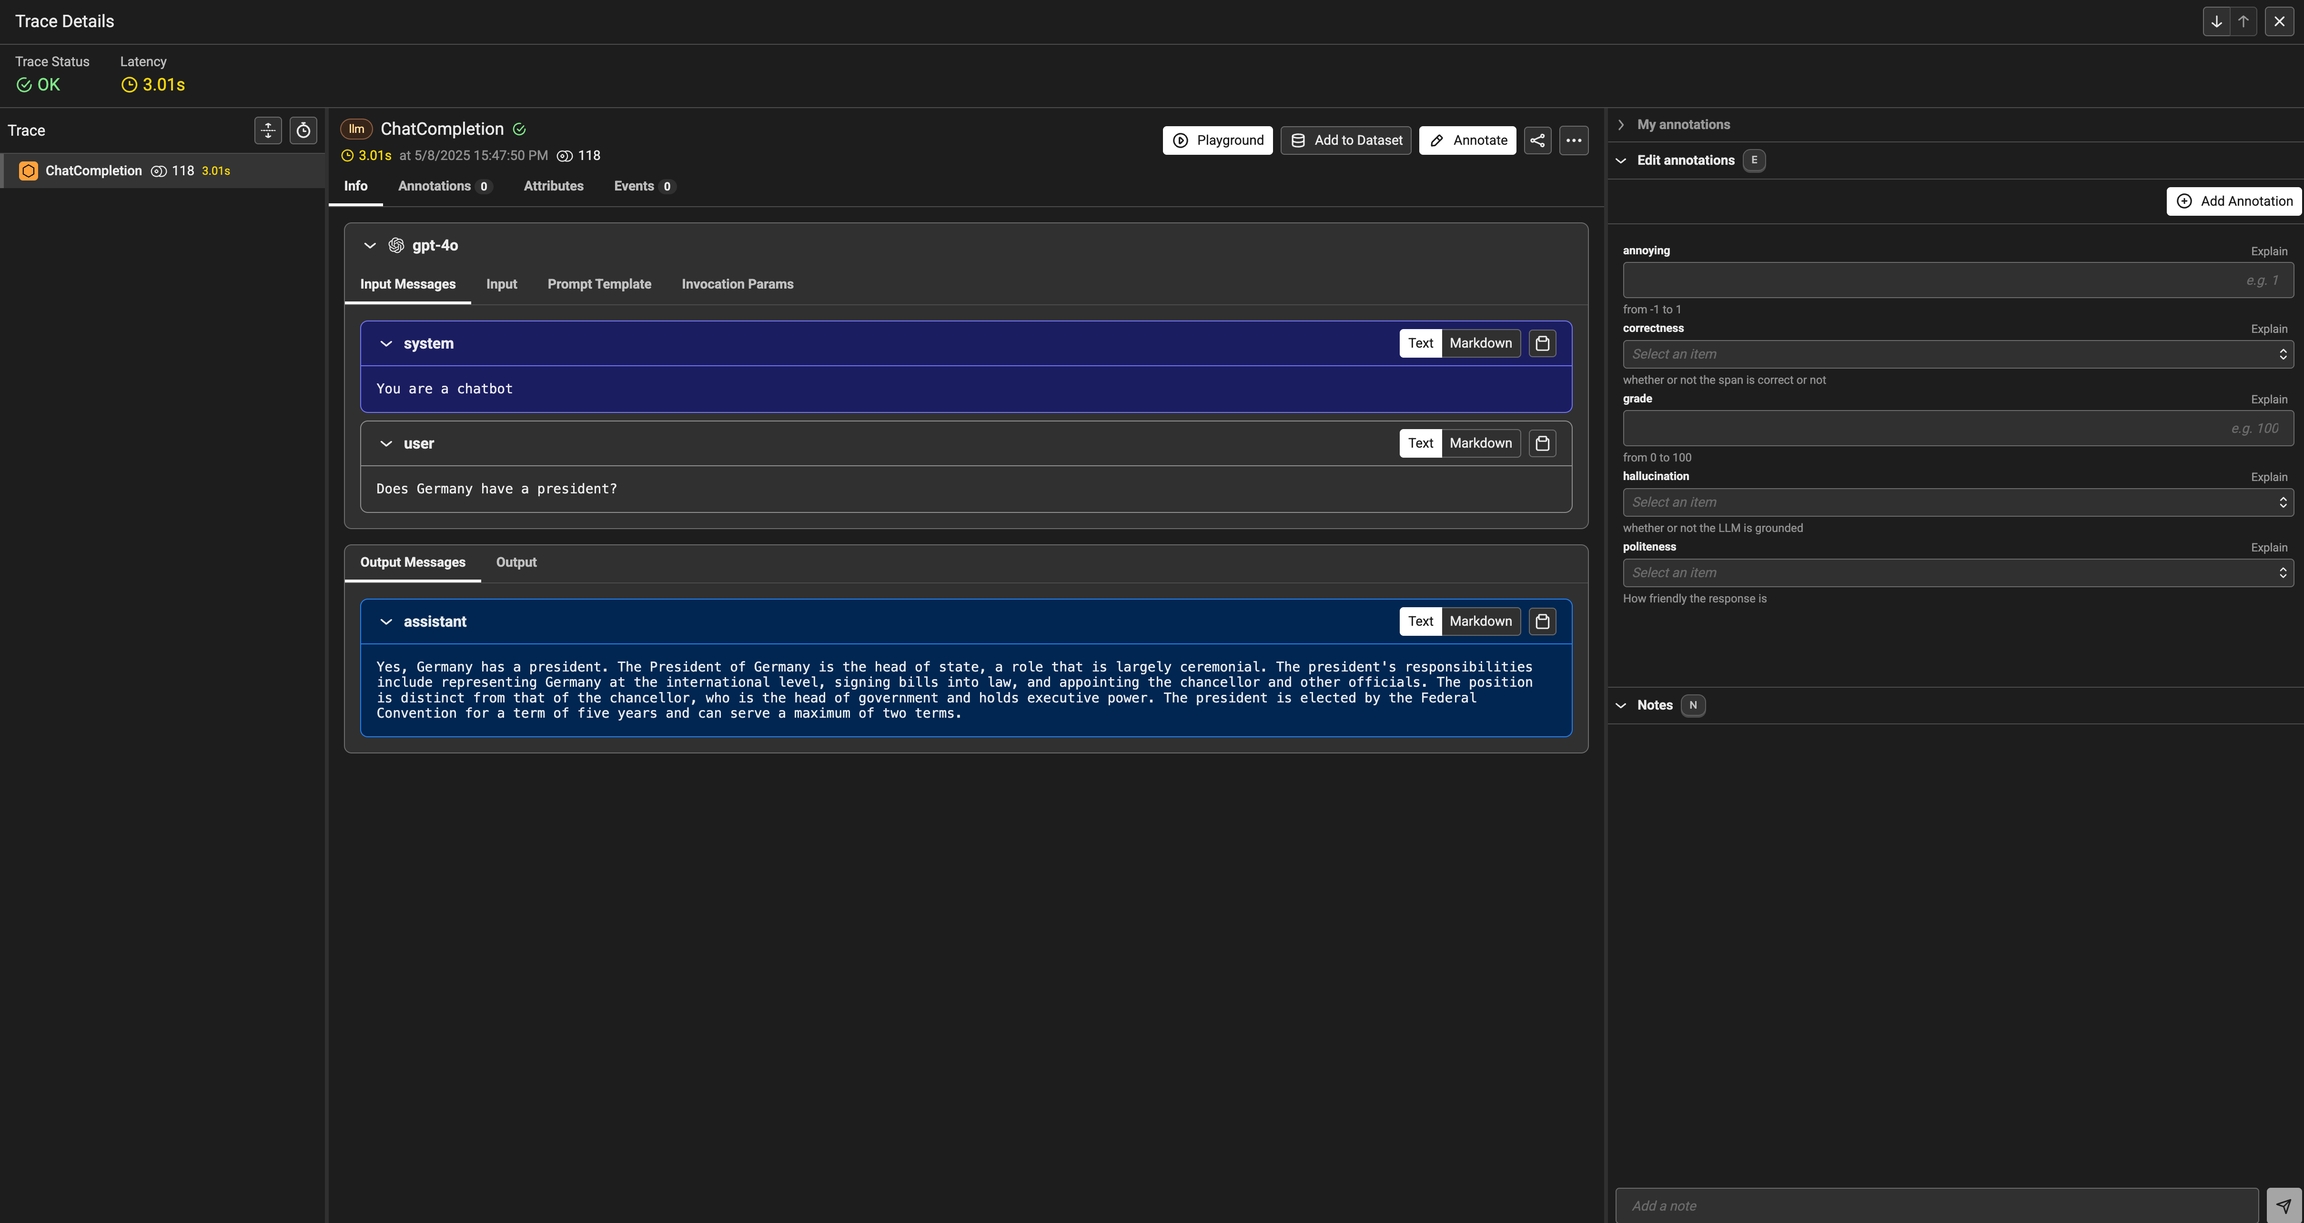
Once annotations are configured, you can add them to your project to build out a custom annotation form
Annotate button and fill out the form to rate different steps in your AI application.
You can annotate at the span, trace, and session level. Spans and traces are annotated from their detail views; to annotate a whole conversation, open a session and use the Annotate button in the session details view to add and edit session-level annotations from the Annotations tab there.
You can also take notes as you go by either clicking on the explain link or by adding your notes to the bottom messages UI.
You can always come back and edit / and delete your annotations. Individual annotations can be deleted from the table view under the Annotations tab. To remove every annotation with a given name across an entire project at once, an admin can use the bulk delete in Project Settings.
Once an annotation has been provided, you can also add a reason to explain why this particular label or score was provided. This is useful to add additional context to the annotation.
Viewing Annotations
As annotations come in from various sources (annotators, evals), the entire list of annotations can be found under theAnnotations tab. Here you can see the author, the annotator kind (e.g. was the annotation performed by a human, llm, or code), and so on. This can be particularly useful if you want to see if different annotators disagree.
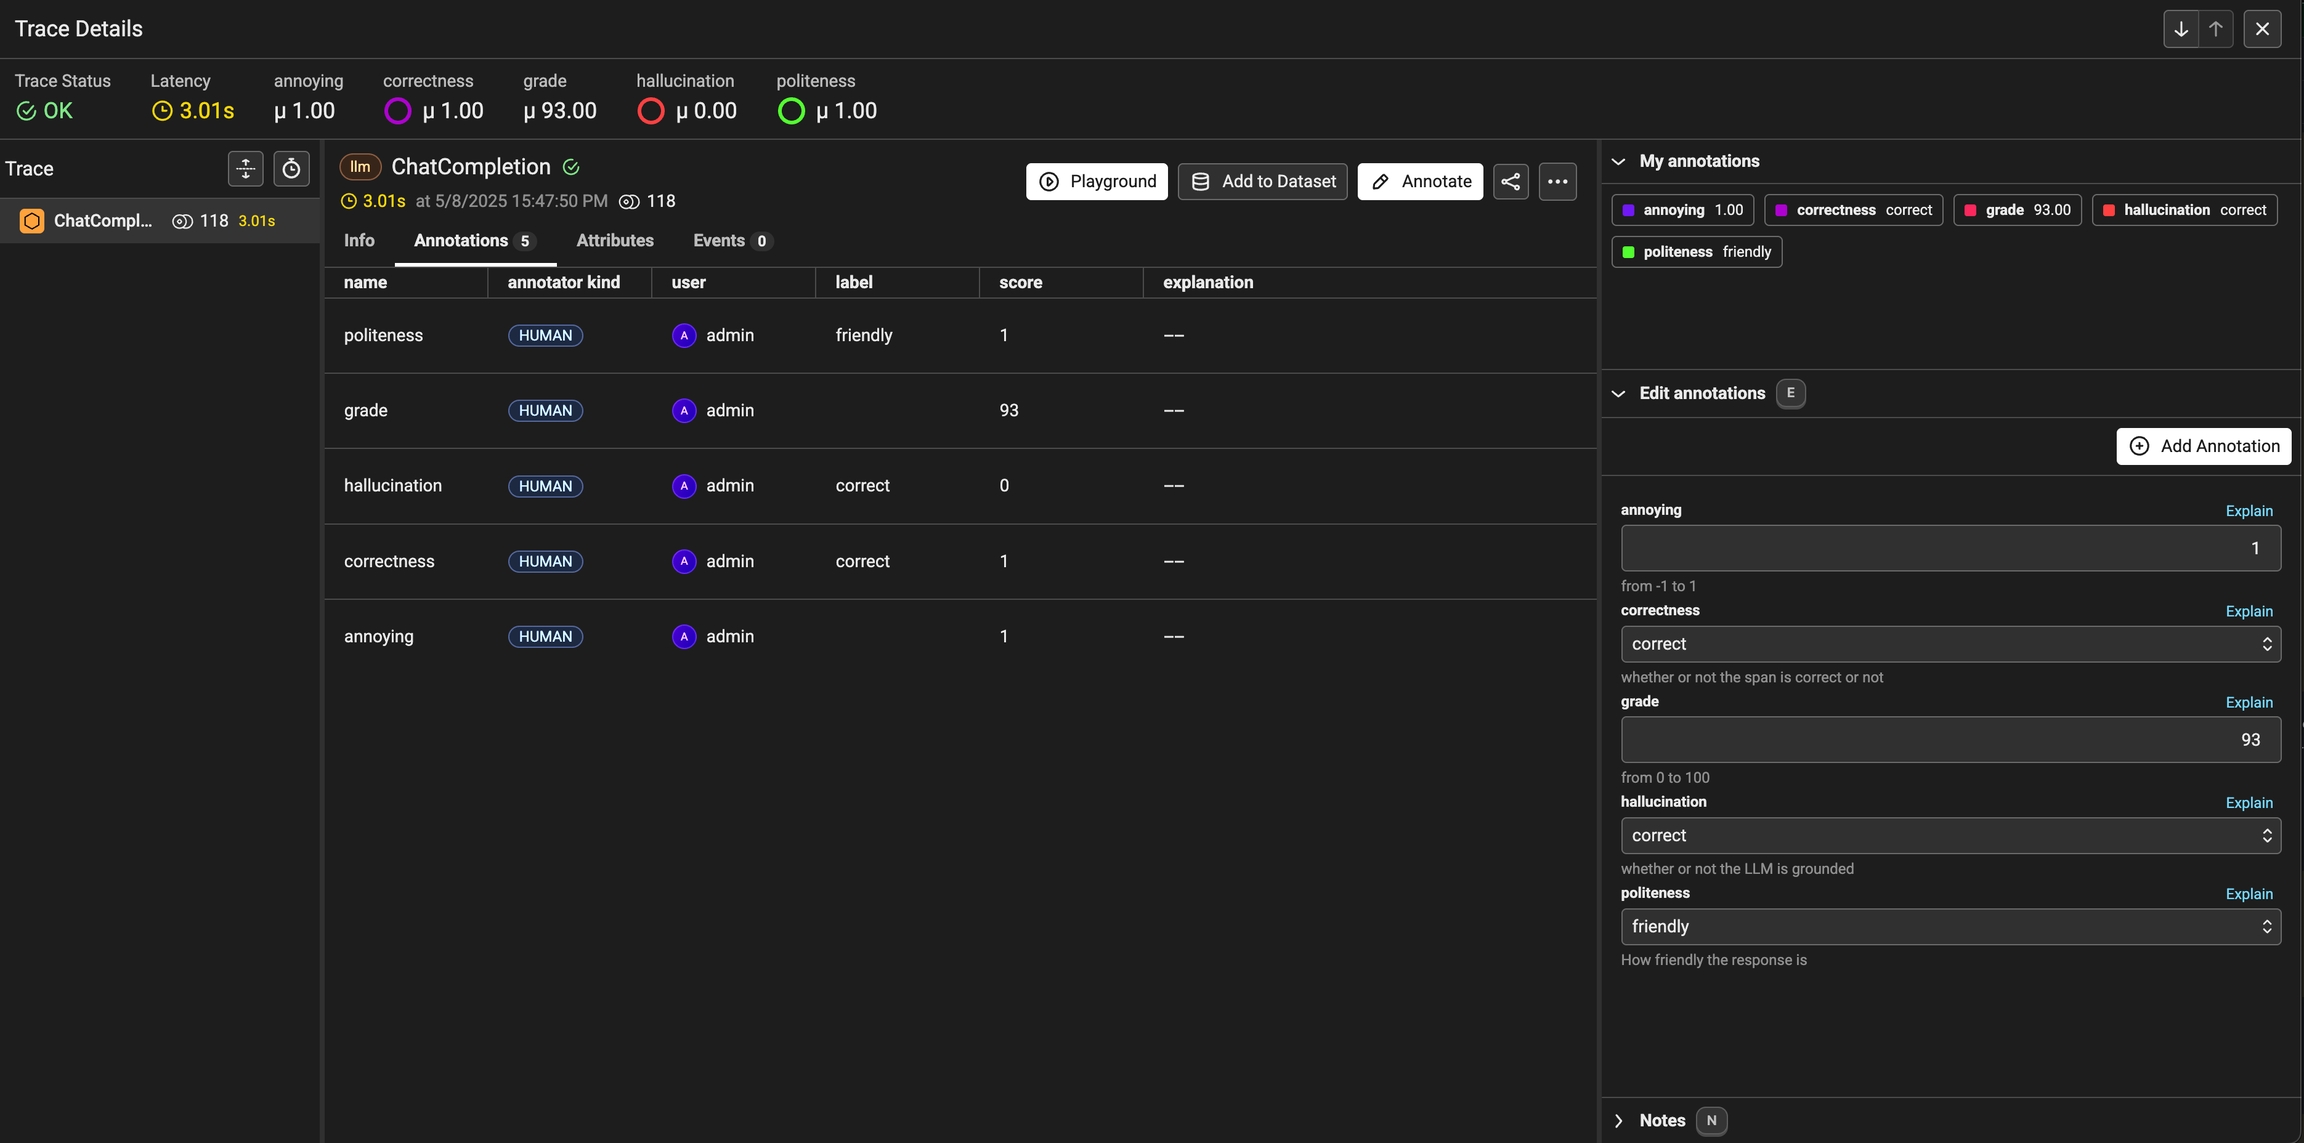
You can view the annotations by different users, llms, and annotators
Exporting Traces with specific Annotation Values
Once you have collected feedback in the form of annotations, you can filter your traces by the annotation values to narrow down to interesting samples (e.x. llm spans that are incorrect). Once filtered down to a sample of spans, you can export your selection to a dataset, which in turn can be used for things like experimentation, fine-tuning, or building a human-aligned eval.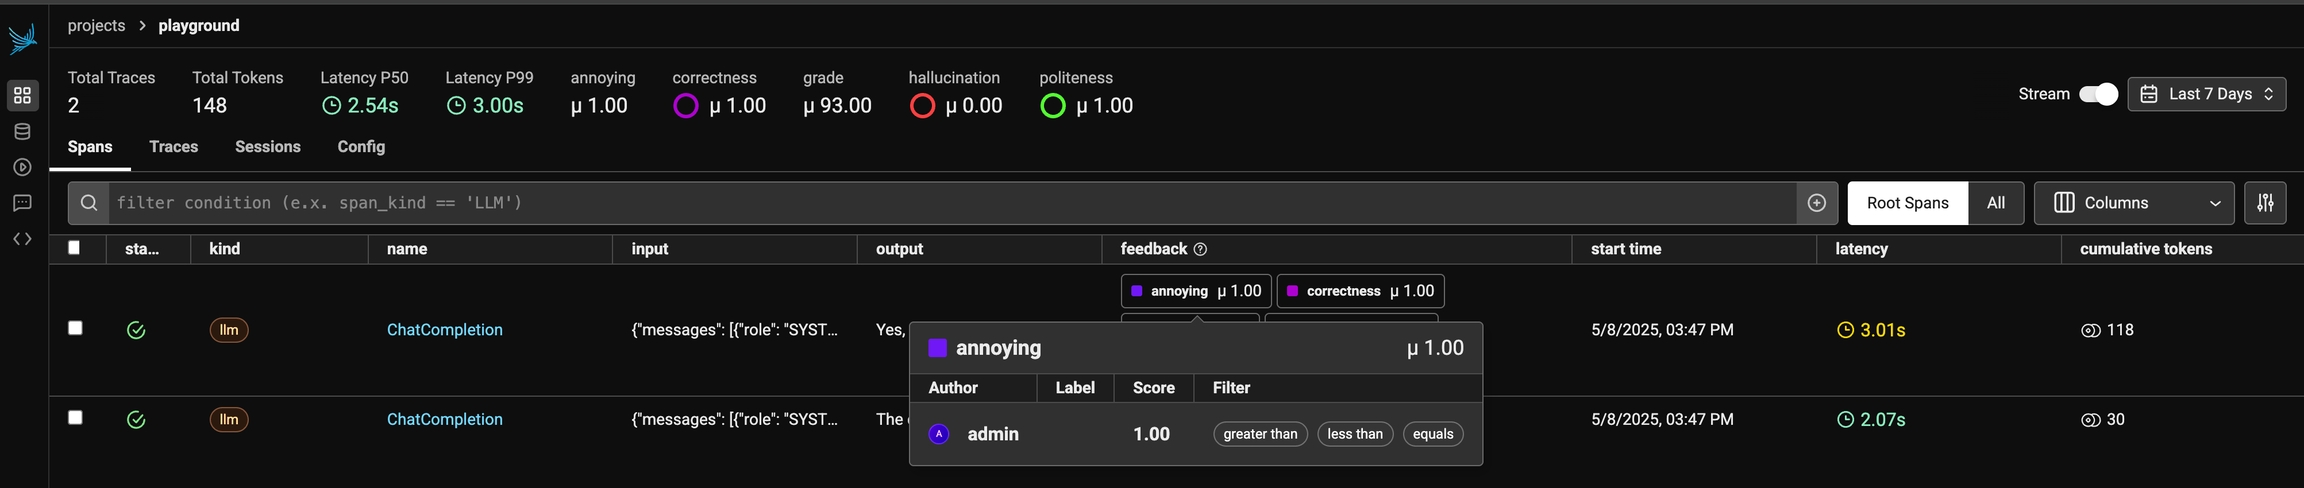
Narrow down your data to areas that need more attention or refinement