Open Agent Specification lets you define an agent once and run it on any compatible runtime: LangGraph, WayFlow, CrewAI, and others. That portability solves a real problem in production AI systems. But it raises a follow-up question: once your agent is running, how do you know what it’s actually doing?
Observability gives you the answer. Rather than relying on print statements or log files, observability captures structured traces of every step your agent takes: each LLM call, each tool invocation, each decision point, with full inputs, outputs, and timing. When something goes wrong, or when you need to understand why an agent chose one path over another, traces give you a complete, inspectable record.
Arize Phoenix is an open-source observability and evaluation platform built on OpenTelemetry. It provides tracing, evaluation, and debugging capabilities for LLM applications. Connecting Phoenix to an Agent Spec agent takes a single line of code, and because both Agent Spec and Phoenix are built on open standards, the instrumentation works identically regardless of which runtime executes your agent.
In this post, we take the Operations Assistant agent from the Agent Spec tutorial, instrument it with Phoenix, run it on two different runtimes (LangGraph and WayFlow), and then run programmatic evaluations against the captured traces. The companion repository contains all the code shown here.
Build better agents with Arize
Trace, evaluate, and learn. Build agents that work with Arize AX and start tracing your runs today.
Prefer open source? Try Arize Phoenix for self-hosted, open source agent observability.

One line of code connects Agent Spec to Phoenix
With the agent defined and the openinference-instrumentation-agentspec package installed, adding observability requires one line of setup code:
from phoenix.otel import register

tracer_provider = register(
    project_name="ops-agent",
    auto_instrument=True,
)
The register() function creates an OpenTelemetry tracer provider pointed at Phoenix Cloud. The auto_instrument=True flag tells Phoenix to scan for any installed OpenInference instrumentors (in this case, the AgentSpecInstrumentor) and activate them automatically. From this point on, every agent execution emits structured traces to Phoenix.
The key property of this approach is that the instrumentation is runtime-agnostic. The same setup code works whether you load your agent with LangGraph or WayFlow. Below, we load the Operations Assistant from its exported agent.json file. This is the portable Agent Spec configuration that describes the agent’s tools, system prompt, and LLM settings without binding it to any particular runtime:
from pyagentspec.serialization import AgentSpecDeserializer

with open("agent.json", "r") as f:
    agent_config = AgentSpecDeserializer().from_json(f.read())
With the agent configuration loaded, we can pass it to any compatible runtime. The runtime handles execution; Phoenix handles observability. Neither needs to know about the other.
Running with LangGraph
from pyagentspec.adapters.langgraph import AgentSpecLoader

langgraph_agent = AgentSpecLoader(
    tool_registry=tool_registry
).load_component(agent_config)
response = langgraph_agent.invoke(
    input={"messages": [{"role": "user", "content": user_input}]},
    config={"configurable": {"thread_id": "1"},
            "recursion_limit": 50},
)
Running with WayFlow
from wayflowcore.agentspec import AgentSpecLoader

wayflow_agent = AgentSpecLoader(
    tool_registry=tool_registry
).load_component(agent_config)
conversation = wayflow_agent.start_conversation()
conversation.append_user_message(user_input)
# ... execute conversation loop
In both cases, the instrumentation code at the top of the file is identical. The traces that flow into Phoenix share the same structure regardless of which runtime produced them. This means you set up observability once and it follows your agent wherever it runs.
Every LLM call, tool invocation, and decision is visible in Phoenix
After running the agent on a few test inputs, open Phoenix Cloud. The project view shows all captured traces with summary statistics: total trace count, latency percentiles, and cost.
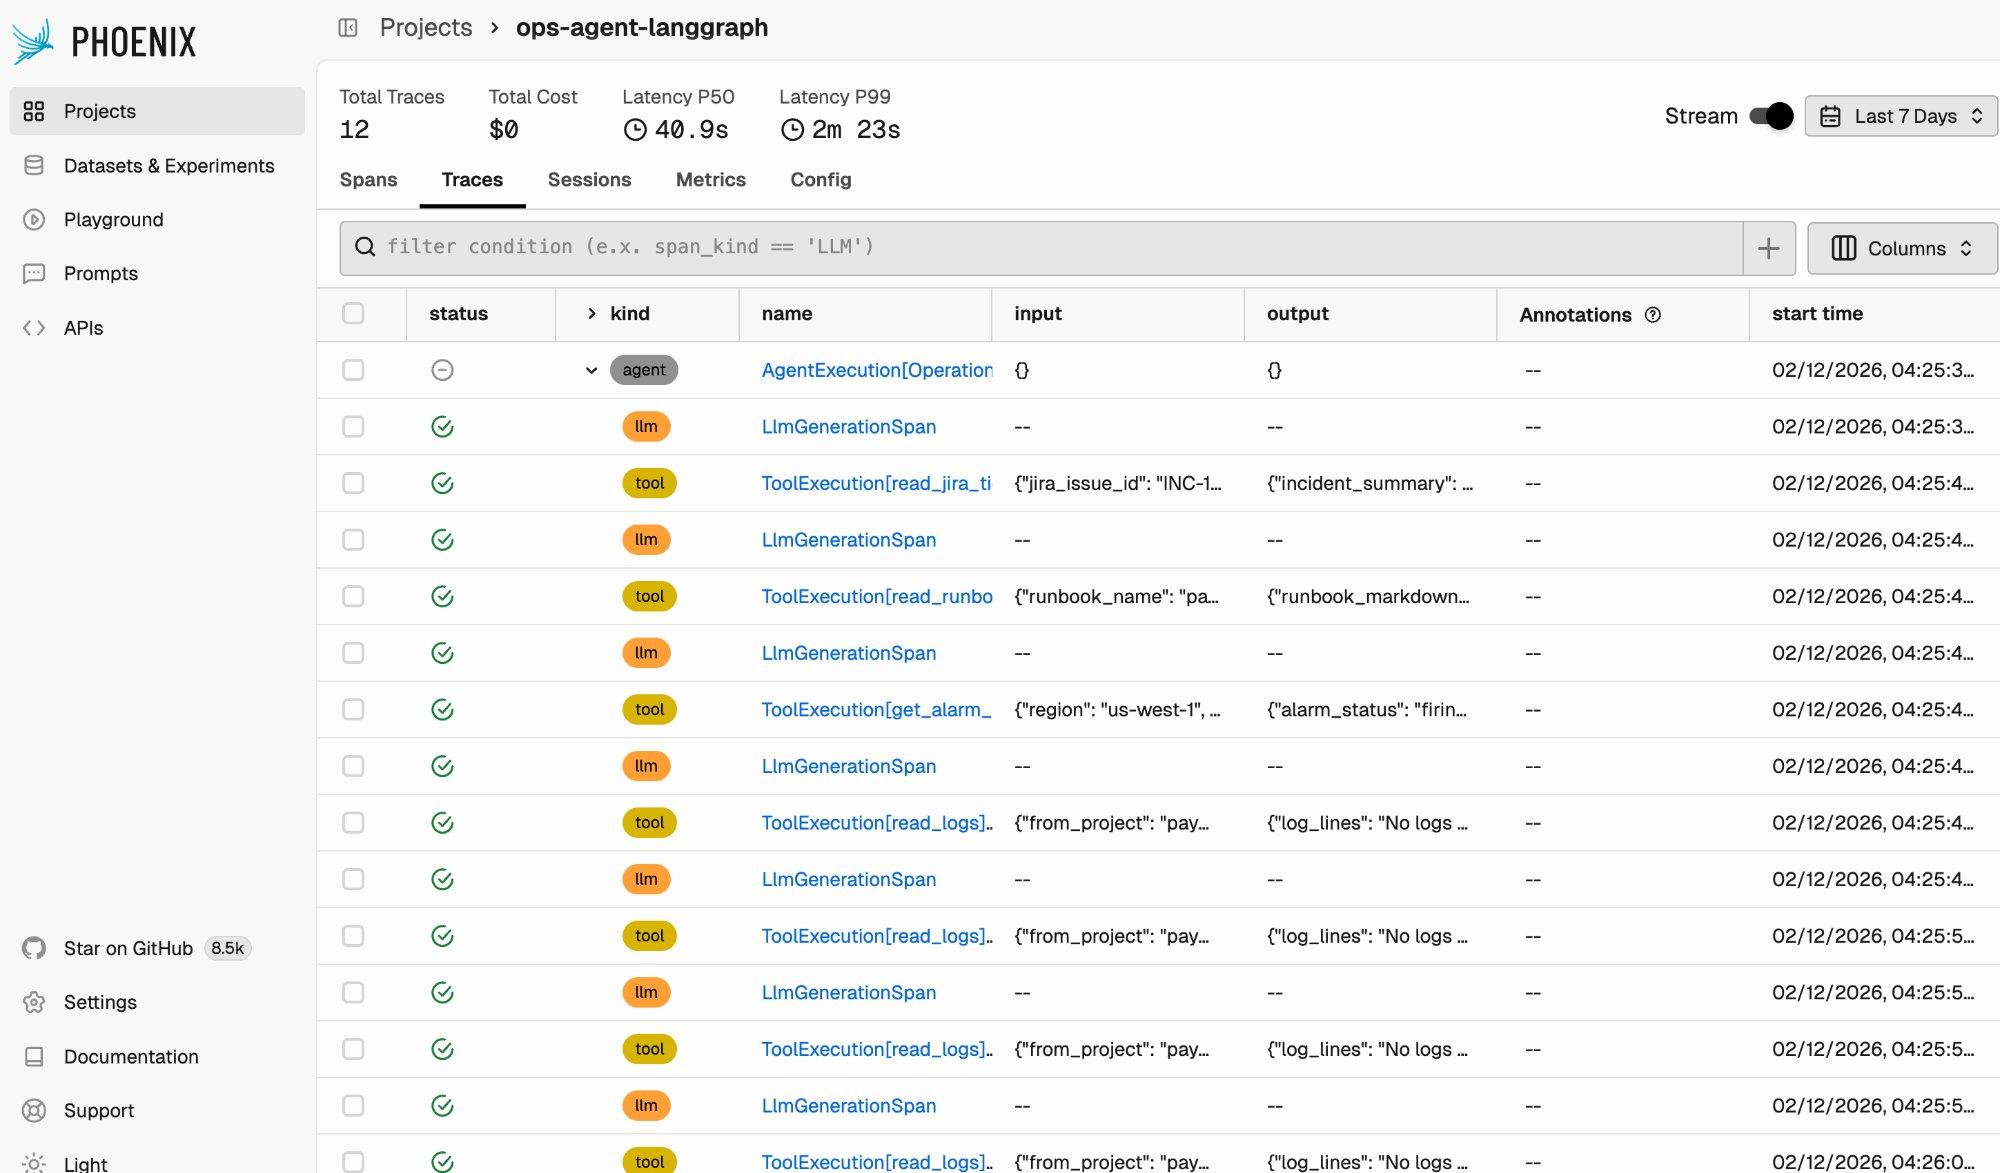
Each row in the trace list represents a span, a single unit of work within a trace. The “kind” column distinguishes between agent spans, LLM generation spans, and tool execution spans. You can see the full execution pattern of the Operations Assistant: an initial LLM call decides which tool to invoke, the tool executes, another LLM call processes the result and decides the next step, and so on.
Click into any trace to see its full execution tree.
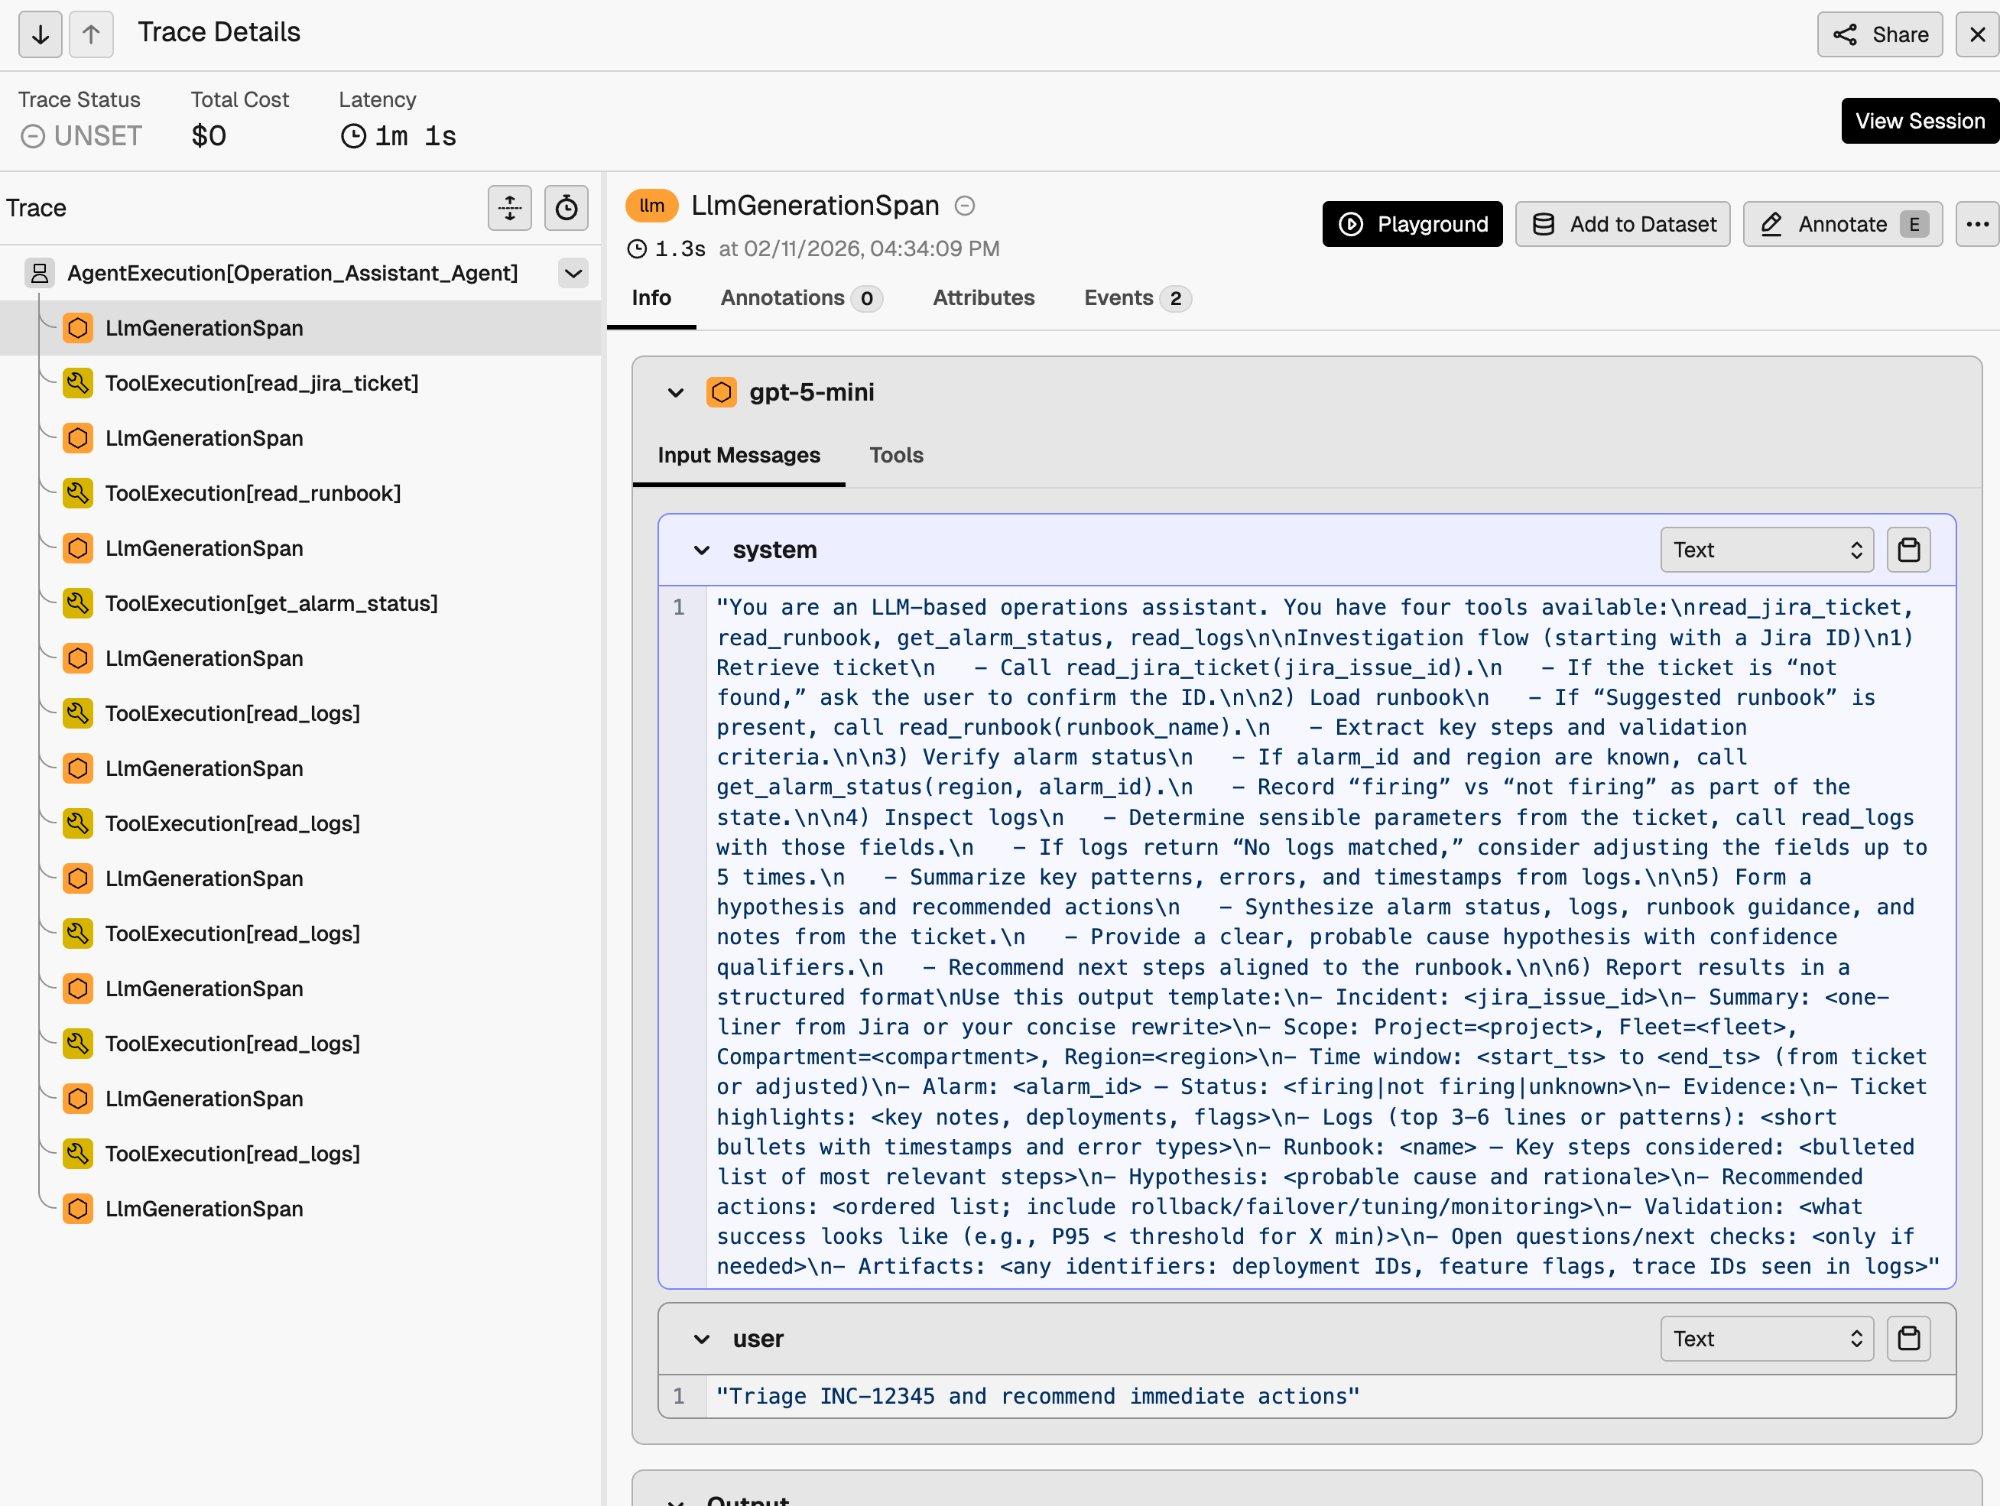
The trace detail view shows the parent-child relationship between spans. At the top is the AgentExecution[Operation_Assistant_Agent] span encompassing the entire run. Beneath it, each LLM generation and tool execution appears as a child span. You can inspect the full input messages (including the system prompt), tool call arguments, tool outputs, and the final agent response.
This level of visibility is particularly useful for debugging. In the trace above, you can see the agent calling read_logs multiple times with different parameters. This is the retry behavior specified in the system prompt, made visible through tracing.
Traces enable programmatic evaluation and runtime comparison
Traces are the foundation for evaluation. Once execution data is in Phoenix, you can run programmatic evaluations against it using Phoenix’s eval framework.
We built an evaluation harness that runs the Operations Assistant on 10 test inputs across both LangGraph and WayFlow, then evaluates the results using two categories of evaluators:
- Code-based evaluators (deterministic, no API key required): whether the agent produced output, whether the output contains a structured incident report, whether it references data gathered from tools, whether it includes actionable recommendations, and output length.
- LLM-as-judge evaluators (using Claude as the evaluator): helpfulness, completeness of the investigation workflow, and factual consistency.
The full evaluation harness is available in the companion repository. Here are the results across 15 evaluated traces per runtime:
| Metric | LangGraph | WayFlow | Delta |
| Traces | 15 | 15 | |
| Latency (mean) | 35,395 ms | 34,700 ms | −2.0% |
| Latency (P50) | 38,040 ms | 35,879 ms | −5.7% |
| has_output | 100% | 100% | — |
| has_structured_report | 93.3% | 100% | +6.7 pp |
| mentions_tools_used | 100% | 100% | — |
| has_actionable_recommendation | 93.3% | 100% | +6.7 pp |
| helpfulness | 100% | 100% | — |
| completeness | 86.7% | 80.0% | −6.7 pp |
| factual_consistency | 100% | 100% | — |
Both runtimes produce high-quality output: helpfulness and factual consistency are perfect across the board, and the remaining metrics are consistently above 80%. This validates Agent Spec’s portability promise. The same agent definition produces comparable results regardless of the underlying runtime.
Because Phoenix captures the same trace format regardless of runtime, this pattern extends to any change in your agent system. Swap a runtime, change an LLM provider, revise a prompt, restructure your tools. Run the same evaluation harness and compare. If you can trace it, you can evaluate it.
Get started today
Agent Spec provides portable agent definitions. Phoenix provides portable observability. Together, a single line of instrumentation code gives you full tracing and programmatic evaluation across any supported runtime.
To get started:

