Production traces are most useful when teams can query them with the rest of their data.
That becomes harder when traces, evaluations, and annotations live only inside an observability system. Agent failures often require context from business tables, product events, customer records, model metadata, prompts, release history, and human review workflows. When observability data sits outside the lakehouse, teams have to export data, maintain custom pipelines, or debug production behavior from a system that cannot easily join against the data that explains what happened.
Today, Arize Data Fabric adds support for Databricks. With this integration, Arize can sync production agent traces, evaluations, and annotations into customer-owned cloud storage. Databricks teams can then register that data in Unity Catalog, apply governance controls, and query it alongside the rest of their lakehouse data.
This gives teams a more direct path from production observability to production analysis. Trace data remains accessible in customer-owned storage, available in open table formats, and governed through the same data platform teams already use for analytics, ML, and AI applications.
Why trace data belongs in the lakehouse
Agent traces are operational records of how an AI system behaves in production. A trace can show which prompt ran, which model responded, which tools were called, which retrieval results were used, how long each step took, which evaluations ran, and how a human reviewer annotated the output.
That data becomes more useful when teams can join it with the rest of the business.
A support agent trace can be analyzed with ticket metadata, account tier, CRM data, escalation history, and customer health scores. A shopping agent trace can be analyzed with product catalog data, conversion events, refund data, inventory, and revenue. A coding assistant trace can be analyzed with repository metadata, pull request outcomes, CI failures, and user feedback.
Those joins help teams move beyond isolated debugging. They can understand which failures matter, where they happen, which users or customers are affected, and whether a fix improved production behavior.
Arize Data Fabric for Databricks is designed to bring that production context into the lakehouse.
How Arize and Databricks fit together
Databricks gives teams a governed environment for data, analytics, ML, and AI workloads. Unity Catalog provides governance for data assets, including access controls, auditability, and lineage.
Arize captures production behavior from AI applications and agents, including traces, spans, model inputs and outputs, tool calls, evaluation results, feedback, and human annotations.
With Arize Data Fabric, those production signals can flow into the same lakehouse architecture teams already use to analyze data and improve AI systems. Arize syncs trace and evaluation data to customer-owned cloud storage. Databricks teams can then use Unity Catalog to register, govern, and query that data with the rest of their enterprise data.
How the sync works
Arize Data Fabric syncs production trace data, evaluations, and annotations to cloud storage every 60 minutes. Each Arize project is written to its own table path, so teams can choose which projects to expose in Databricks and how to organize them in Unity Catalog.
A typical setup looks like this:
- Create a Data Fabric connector in Arize.
- Point the connector at your cloud storage bucket and select the Arize projects to sync.
- Grant Arize the required access to the bucket and prefix.
- Validate the connector and start the first sync.
- Register the synced data in Unity Catalog using the setup flow documented by Arize.
Once the first sync completes, trace data is available in the storage location you configured. From there, Databricks teams can register the data in Unity Catalog, apply permissions, query it from Databricks SQL, and use it in downstream workflows.
For the exact setup steps, including cloud storage permissions and Unity Catalog registration, use the Arize Data Fabric documentation.
Query production agent behavior with Databricks SQL
Once traces are available through Unity Catalog, teams can analyze production agent behavior with the same SQL workflows they already use for lakehouse data.
The exact schema depends on your Arize project, trace structure, and configured attributes. The queries below show the kind of analysis teams can run once trace fields, evaluation results, and business identifiers are available in the synced tables.
For example, a team could look for prompt and evaluator combinations associated with failed traces:
SELECT
  prompt_template,
  evaluator_name,
  COUNT(*) AS total_traces,
  SUM(CASE WHEN eval_result = 'fail' THEN 1 ELSE 0 END) AS failed_traces
FROM my_catalog.arize_traces.production_agent
WHERE start_time >= current_date() - INTERVAL 7 DAYS
GROUP BY prompt_template, evaluator_name
ORDER BY failed_traces DESC;
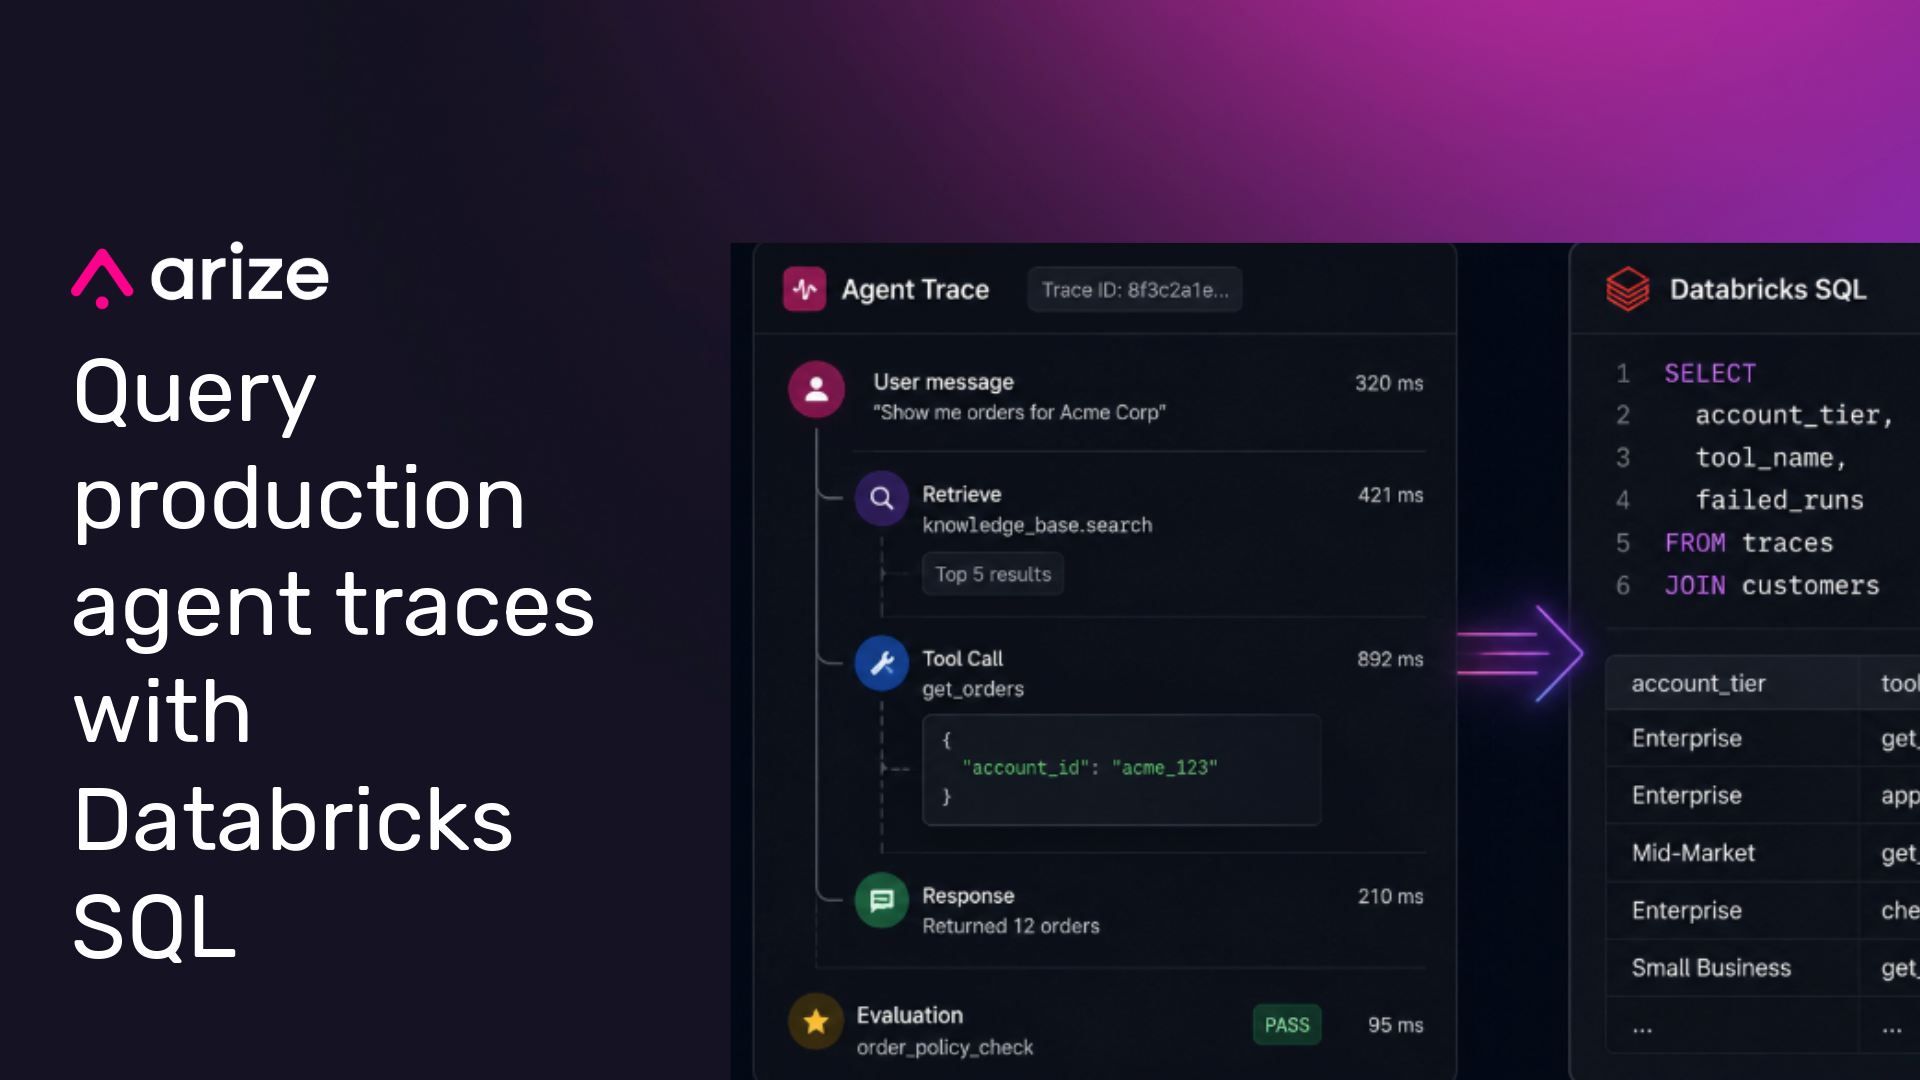
Trace data becomes more useful when it is joined with business data:
SELECT
  c.account_tier,
  t.tool_name,
  COUNT(*) AS tool_calls,
  AVG(t.latency_ms) AS avg_latency_ms,
  SUM(CASE WHEN t.eval_result = 'fail' THEN 1 ELSE 0 END) AS failed_runs
FROM my_catalog.arize_traces.production_agent t
JOIN my_catalog.salesforce.customers c
  ON t.customer_id = c.customer_id
WHERE t.start_time >= current_date() - INTERVAL 30 DAYS
GROUP BY c.account_tier, t.tool_name
ORDER BY failed_runs DESC;
These examples are illustrative. In practice, teams can adapt the query pattern to match their synced Arize schema, application metadata, and lakehouse tables.
The value is the join. Teams can analyze which tools fail most often, which customer segments are affected, whether a prompt change increased latency, or which evaluation failures correlate with downstream business impact.
Use Genie Spaces for natural language trace analysis
Not every stakeholder who needs trace data wants to write SQL.
When Arize trace data is registered in Unity Catalog, teams can make that data available through Databricks surfaces such as Genie Spaces and Databricks SQL. A Genie Space lets users ask natural-language questions about curated Unity Catalog datasets and receive SQL-backed answers, result tables, and visualizations.
That can help product managers, analysts, support leaders, and operations teams explore agent behavior without starting from a blank SQL editor.
Useful questions might include:
- Which prompts had the highest evaluation failure rate last week?
- Which tool calls added the most latency yesterday?
- Which customer accounts saw the most failed agent runs this month?
- Did the latest release reduce failed checkout-agent traces?
- Which retrieval sources appear most often in low-quality responses?
Genie Spaces work best when the underlying datasets are well documented and curated. Teams should define the relevant tables, views, joins, column descriptions, and business context so natural-language questions map to accurate SQL.
Because the trace data lives alongside product, customer, and revenue data, these questions can connect agent behavior to operational outcomes.
Turn production traces into agent improvement workflows
Production traces can also help teams improve agents.
Teams building agents on Databricks can use synced Arize data to identify failures, build datasets, compare variants, and evaluate changes against real production behavior. A failed production run can become a regression example. A high-quality human annotation can become evaluation data. A recurring tool failure can become the basis for an experiment.
Production traces and evaluations can help teams:
- Find recurring failure patterns across tools, prompts, retrieval steps, and agent workflows.
- Build datasets from real production examples.
- Compare new agent variants against historical failures.
- Use evaluation results to define MLflow experiments and compare changes.
- Track whether a prompt, tool, model, or retrieval change improved production quality.
The goal is to make production behavior reusable. Teams should be able to take what Arize observes in production and apply it to the workflows they use to improve agents.
Govern agent observability data with Unity Catalog
Agent traces can contain sensitive operational context, including user inputs, retrieved documents, tool responses, and model outputs. That makes governance a core requirement for production agent observability.
By registering Arize Data Fabric tables in Unity Catalog, teams can apply familiar governance controls to trace and evaluation data. Access policies, audit logs, and lineage can follow the same patterns teams already use for analytics, ML, and AI workloads.
That matters because agent observability data often needs to be shared across teams. Engineers need traces for debugging. ML teams need evaluation data for experiments. Product teams need quality and latency trends. Support teams need visibility into customer-impacting failures. Security and governance teams need confidence that access to sensitive data is controlled.
With Unity Catalog, those workflows can operate from a shared governed layer instead of a separate export pipeline.
Built on open data in customer-owned storage
Arize Data Fabric is designed around a simple architectural principle: production observability data should remain accessible in customer-owned infrastructure.
Trace and evaluation data is written to cloud storage controlled by the customer. Databricks teams can register, query, and govern that data through Unity Catalog using the Data Fabric setup flow. From there, teams can analyze it with Databricks SQL, expose curated datasets through Genie Spaces, build dashboards, and use the data in downstream ML and agent-improvement workflows.
For teams running agents on Databricks, this brings production observability data into the same environment where they already build, govern, and improve AI systems.
Get started
Arize Data Fabric for Databricks is rolling out to enterprise customers now.
Reach out to your Arize account team or email support@arize.com to join the waitlist. For setup details, see the Arize Data Fabric documentation.