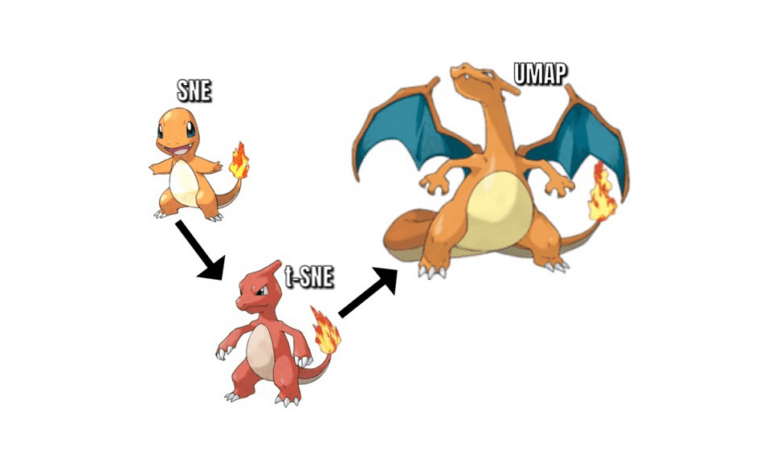
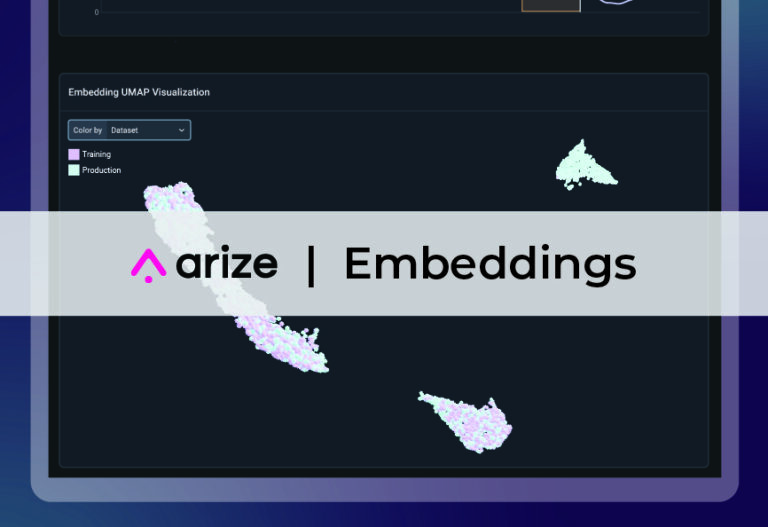
Uniform Manifold Approximation and Projection (UMAP) is a technique for visualizing the embedding representation of a dataset using dimension reduction. It has many similarities with t-SNE as well as some critical differences that have made UMAP the preferred choice for dimension reduction for many practitioners. In the optimization phase of the algorithm, the creators of UMAP made design decisions that played a crucial role in its great performance, including using cross entropy as loss function while t-SNE uses KL divergence, and using stochastic gradient descent to minimize the cost function instead of slower gradient descent.
Build better agents with Arize
Trace, evaluate, and learn. Build agents that work with Arize AX and start tracing your runs today.
Prefer open source? Try Arize Phoenix for self-hosted, open source agent observability.

Key takeaways
- UMAP projects high-dimensional points to 2D or 3D for visualization while preserving local and some global structure.
- Often faster than classic t-SNE on larger samples and scales more gracefully in production monitoring notebooks.
- Hyperparameters (n_neighbors, min_dist) control local versus global layout; fix them when comparing over time.
- Use UMAP on sampled batches for embedding drift review, not as training features.
- Pair plots with quantitative cluster and retrieval metrics; visuals guide hypotheses only.
How UMAP differs from t-SNE
Both are nonlinear visualization methods. UMAP builds a fuzzy topological representation of data and optimizes a cross-entropy objective in low dimensions.
t-SNE emphasizes local neighborhoods with t-distributed pairwise costs; global distances between clusters are less trustworthy in both methods, but UMAP often preserves broader layout.
UMAP supports transform steps to project new points relative to a fitted manifold (with caution and retraining on representative samples).
Hyperparameters to document
n_neighbors balances local versus global structure (typical 5 to 50).
min_dist controls how tightly points pack in the embedding (lower tighter clusters).
metric in high-dimensional space (cosine common for embeddings).
random_state for reproducible monitoring plots.
Log sample size, embedding model version, and parameters beside every plot stored in incident tickets.
Uses in embedding monitoring
Weekly samples of document or query embeddings colored by error type, language, or product line.
Detect emerging topic islands after content or catalog changes.
Compare canary model embeddings to stable baseline clusters.
Investigate moderation or safety outliers as spatial cliques.
Guides on AI model lifecycle management include visualization in drift triage workflows.
Slice-oriented monitoring from shipping image classification models with confidence parallels embedding cohort reviews for NLP services.
Eval platforms in LLM and agent evaluation platforms can store plot metadata and sample ids for audit trails.
Pitfalls
Treating UMAP axes as meaningful distances for ranking or thresholds.
Refitting UMAP with different seeds and calling it drift without fixed protocol.
Plotting unnormalized mixed embedding spaces from different models in one chart.
Using UMAP coordinates downstream in models, which distorts geometry.
Transform cautions
When using UMAP transform on new points against a fitted map, validate on held-out samples before trusting drift visuals.
Combined views
Side-by-side UMAP colored by error type and by model version quickly shows whether a deploy shifted embedding space occupancy.
Practitioner checklist
Before changing production settings, confirm labels, thresholds, and monitor windows match the definitions used in your last offline eval. Snapshot dashboards when incidents start so postmortems compare apples to apples.
Run slice-level reviews on high-traffic cohorts weekly even when global metrics look flat. Many failures appear first in one locale, product line, or prompt route.
Document model version, featurizer hash, and data window in every incident ticket. Future you needs that context to interpret drift charts.
When metrics disagree (offline vs online, precision vs recall), write down the business cost of each error type before picking a fix. Metrics are proxies; costs are the decision.
Share eval harness links in release notes so support and PM teams know which golden tasks must pass before they announce improvements.
FAQ
Should I use UMAP or t-SNE?
Try both on the same sample; UMAP is often preferred for speed and larger n; t-SNE for fine local detail.
Can UMAP monitor production embeddings automatically?
Run scheduled offline jobs on stratified samples; alert on cluster proportion changes quantitatively, use UMAP to explain.
Does UMAP replace PCA?
No. PCA is linear and useful for preprocessing; UMAP is for visualization and exploration.
How many points can UMAP handle?
Thousands to tens of thousands in notebooks; subsample larger corpora representatively.
Can I project new points without refitting?
UMAP has transform APIs but quality drops if the manifold shifts; refit on refreshed reference samples periodically.