Check out our Demand Forecasting Colab for an interactive demo and our best practices blog for additional industry context!Documentation Index
Fetch the complete documentation index at: https://arize-ax.mintlify.dev/docs/llms.txt
Use this file to discover all available pages before exploring further.
Monitors
Using the Arize Dashboard function, you can quickly set-up a Mean Error monitor that notifies you when model Mean Error dips below a specific number. You can do this for any evaluation metric on Arize (i.e MAE, MSE, MAPE).
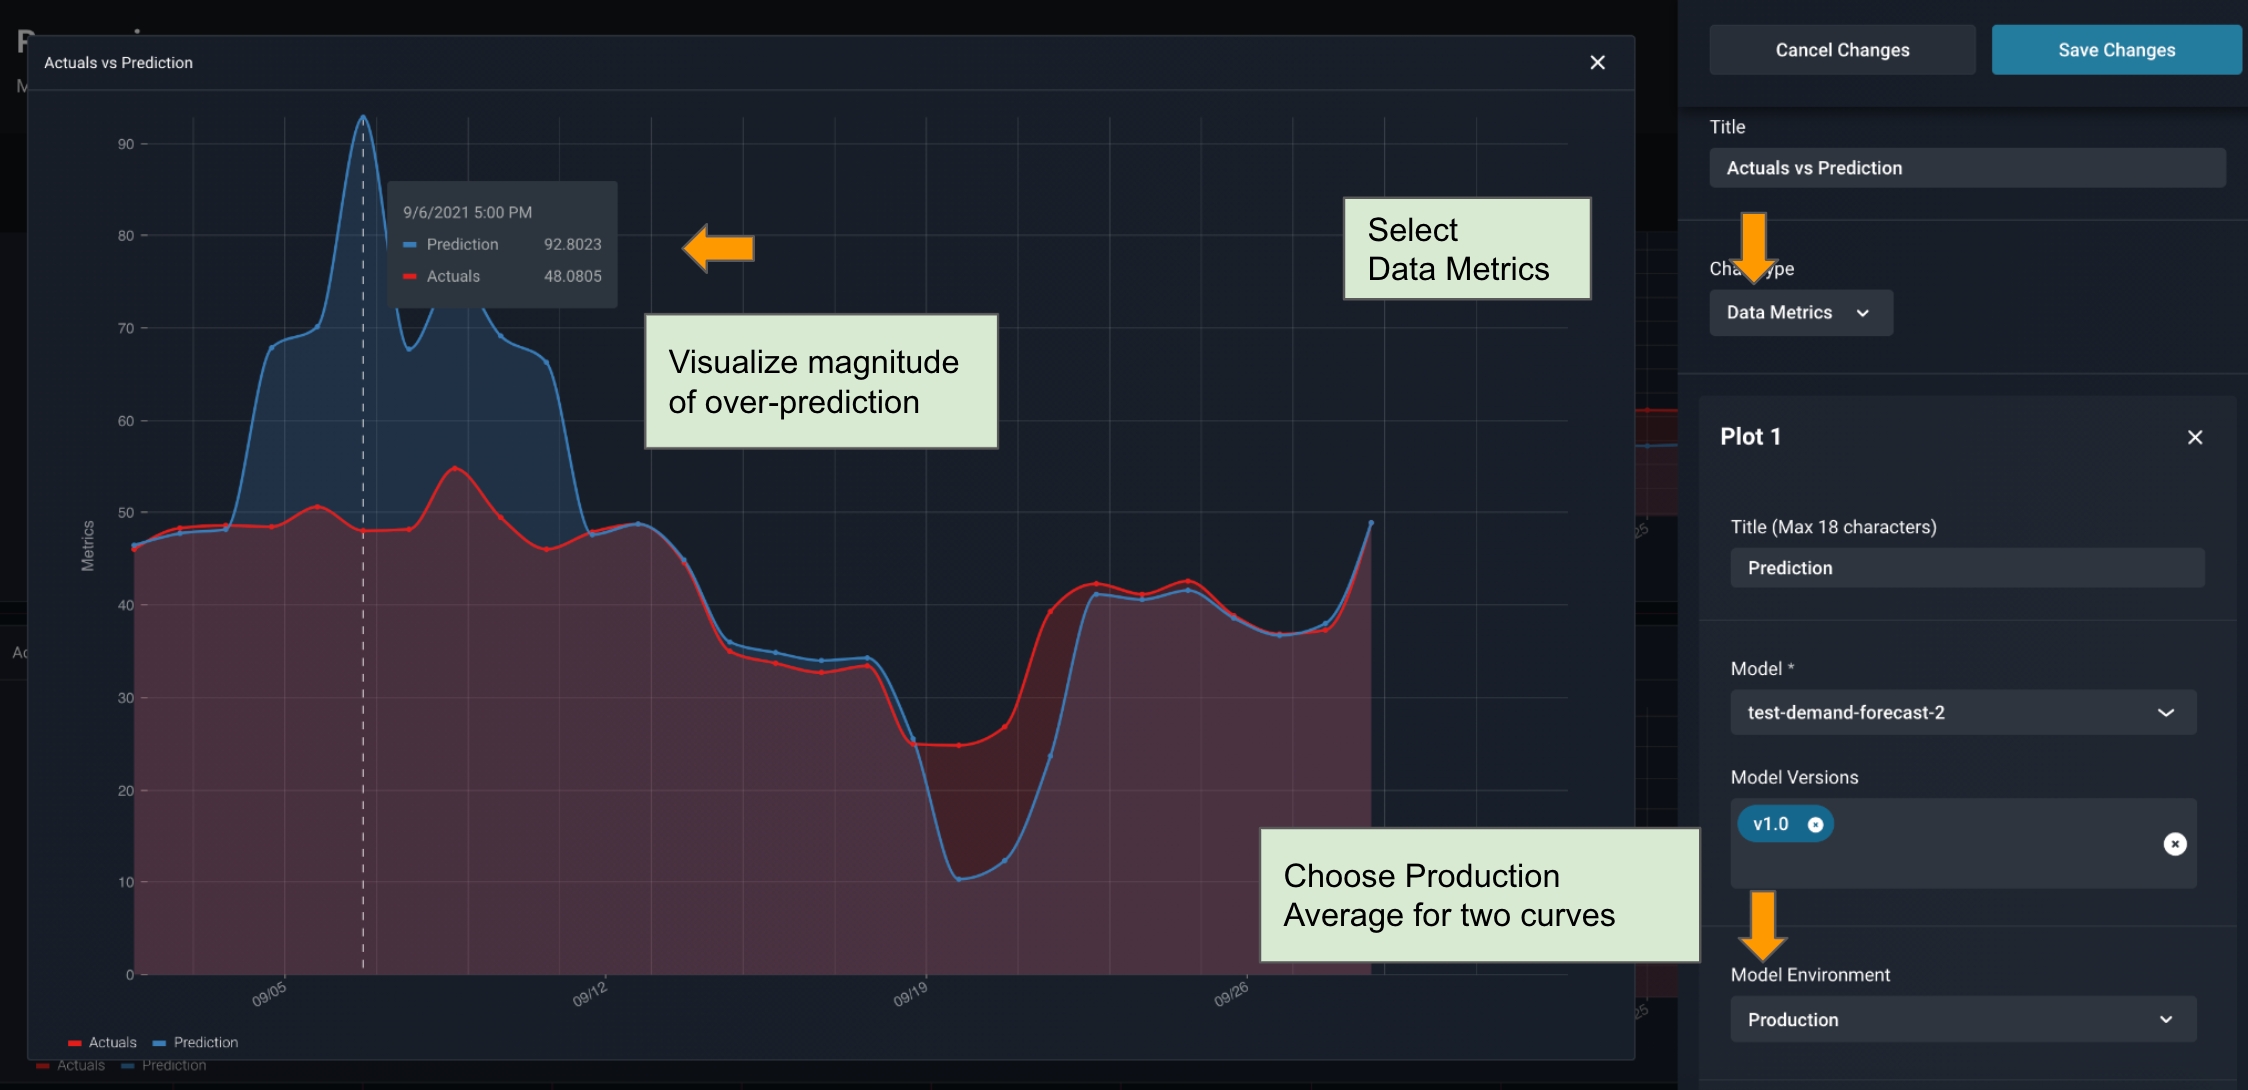
Customizable Performance Dashboard
Mean Error alone is not enough to tell the story. In a feature drift event where there is both over-prediction and under prediction, mean error could be cancelled out to be zero. This is why we will not only need monitors, but a side-by-side chart to allow us to compare the magnitude and direction of both Mean Absolute Error and Mean Error. We can configure times series cards with custom model metrics on the Performance Dashboard, as shown below.
Visualizing Data Metric and Errors side-by-side
In the Arize Dashboard shown below, it’s clear that we see an over prediction event first, then an under prediction event later. We can clearly see the magnitude of these errors based on our custom configuration.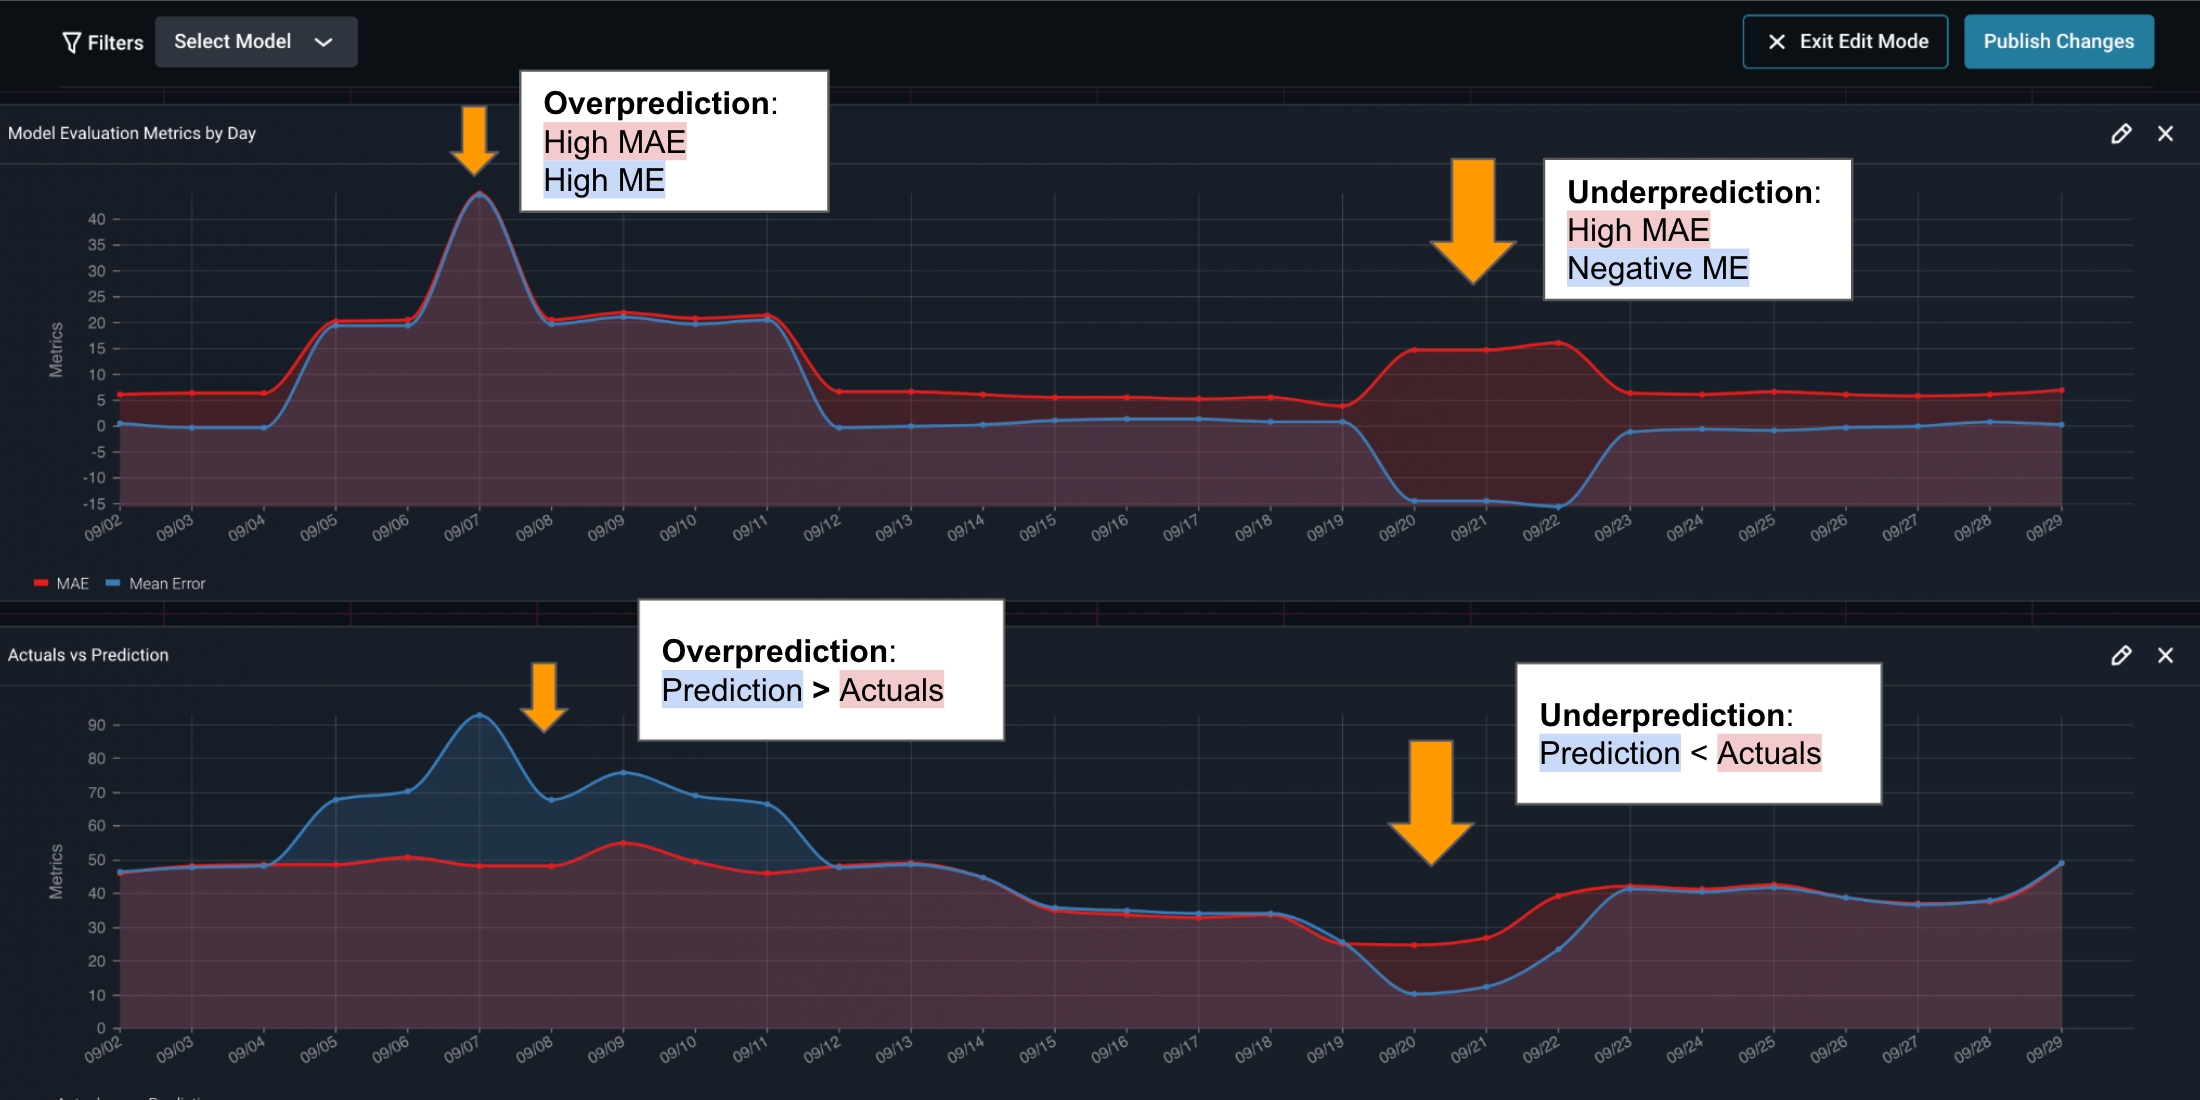
Investigating Feature Drift
Arize can also be used to triage your ML model performance. The model performance troubleshooting tools are designed by ML engineers for engineers to help you understand and solve your model performance issues.
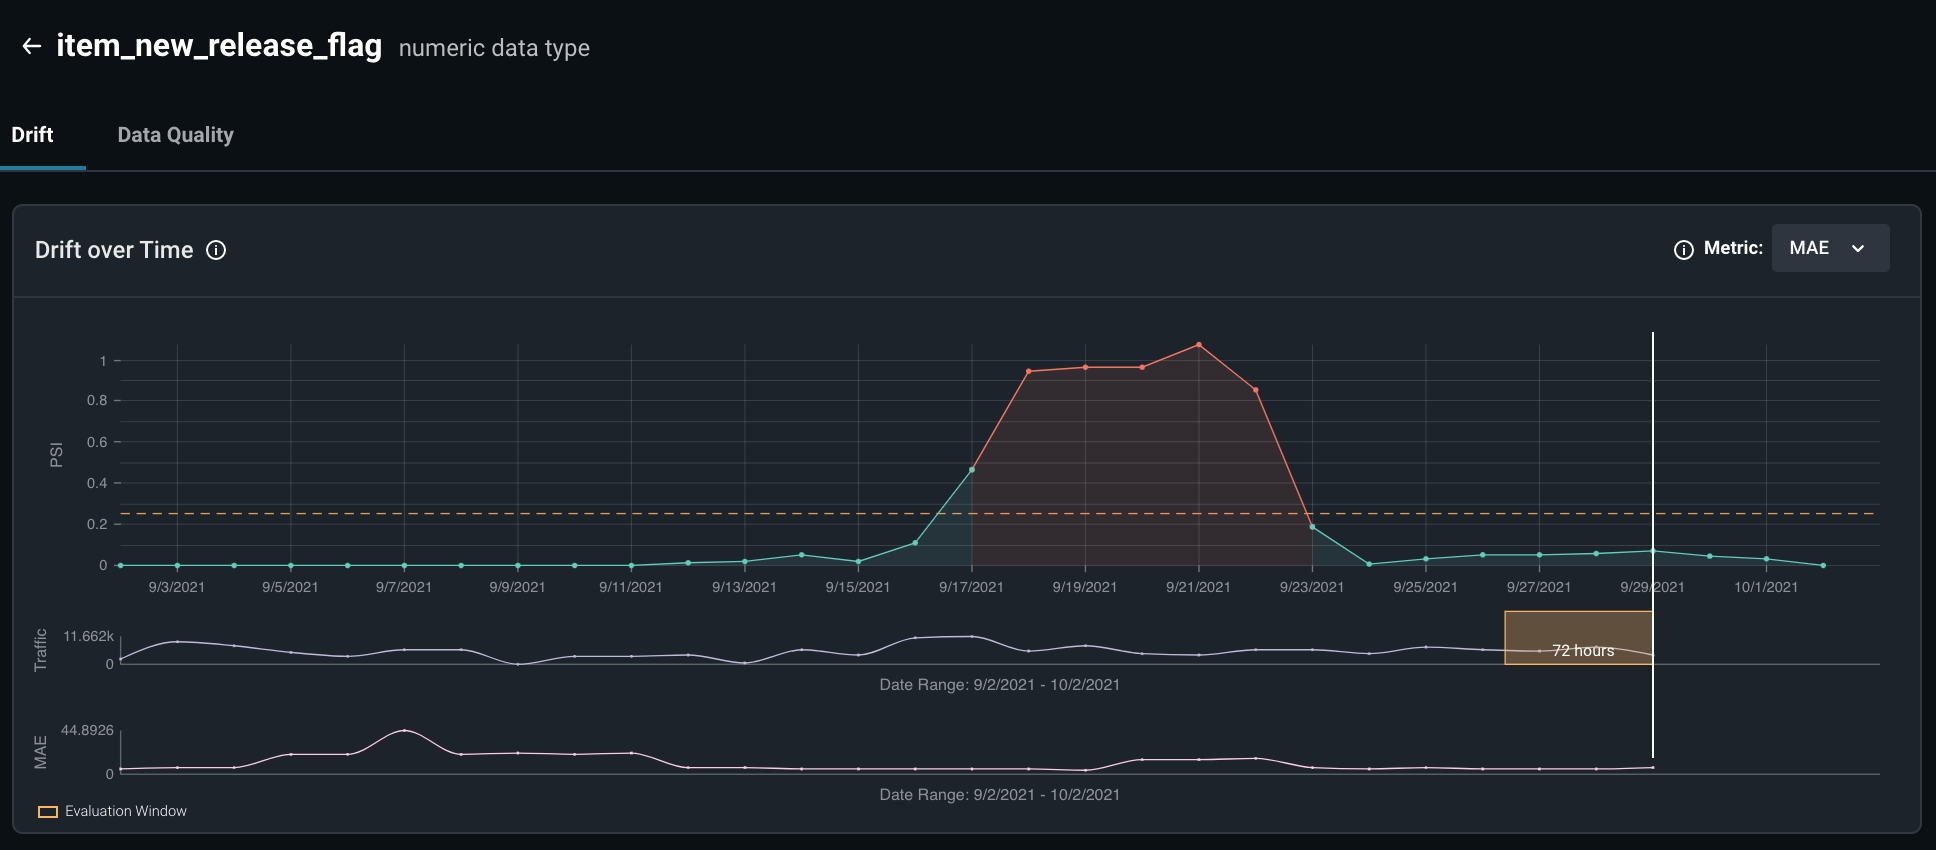
- Examining possible concept drifts relating to the features in question
- Retraining our model to fit new distributions specific to this drift