Forecasting sales data with Arize
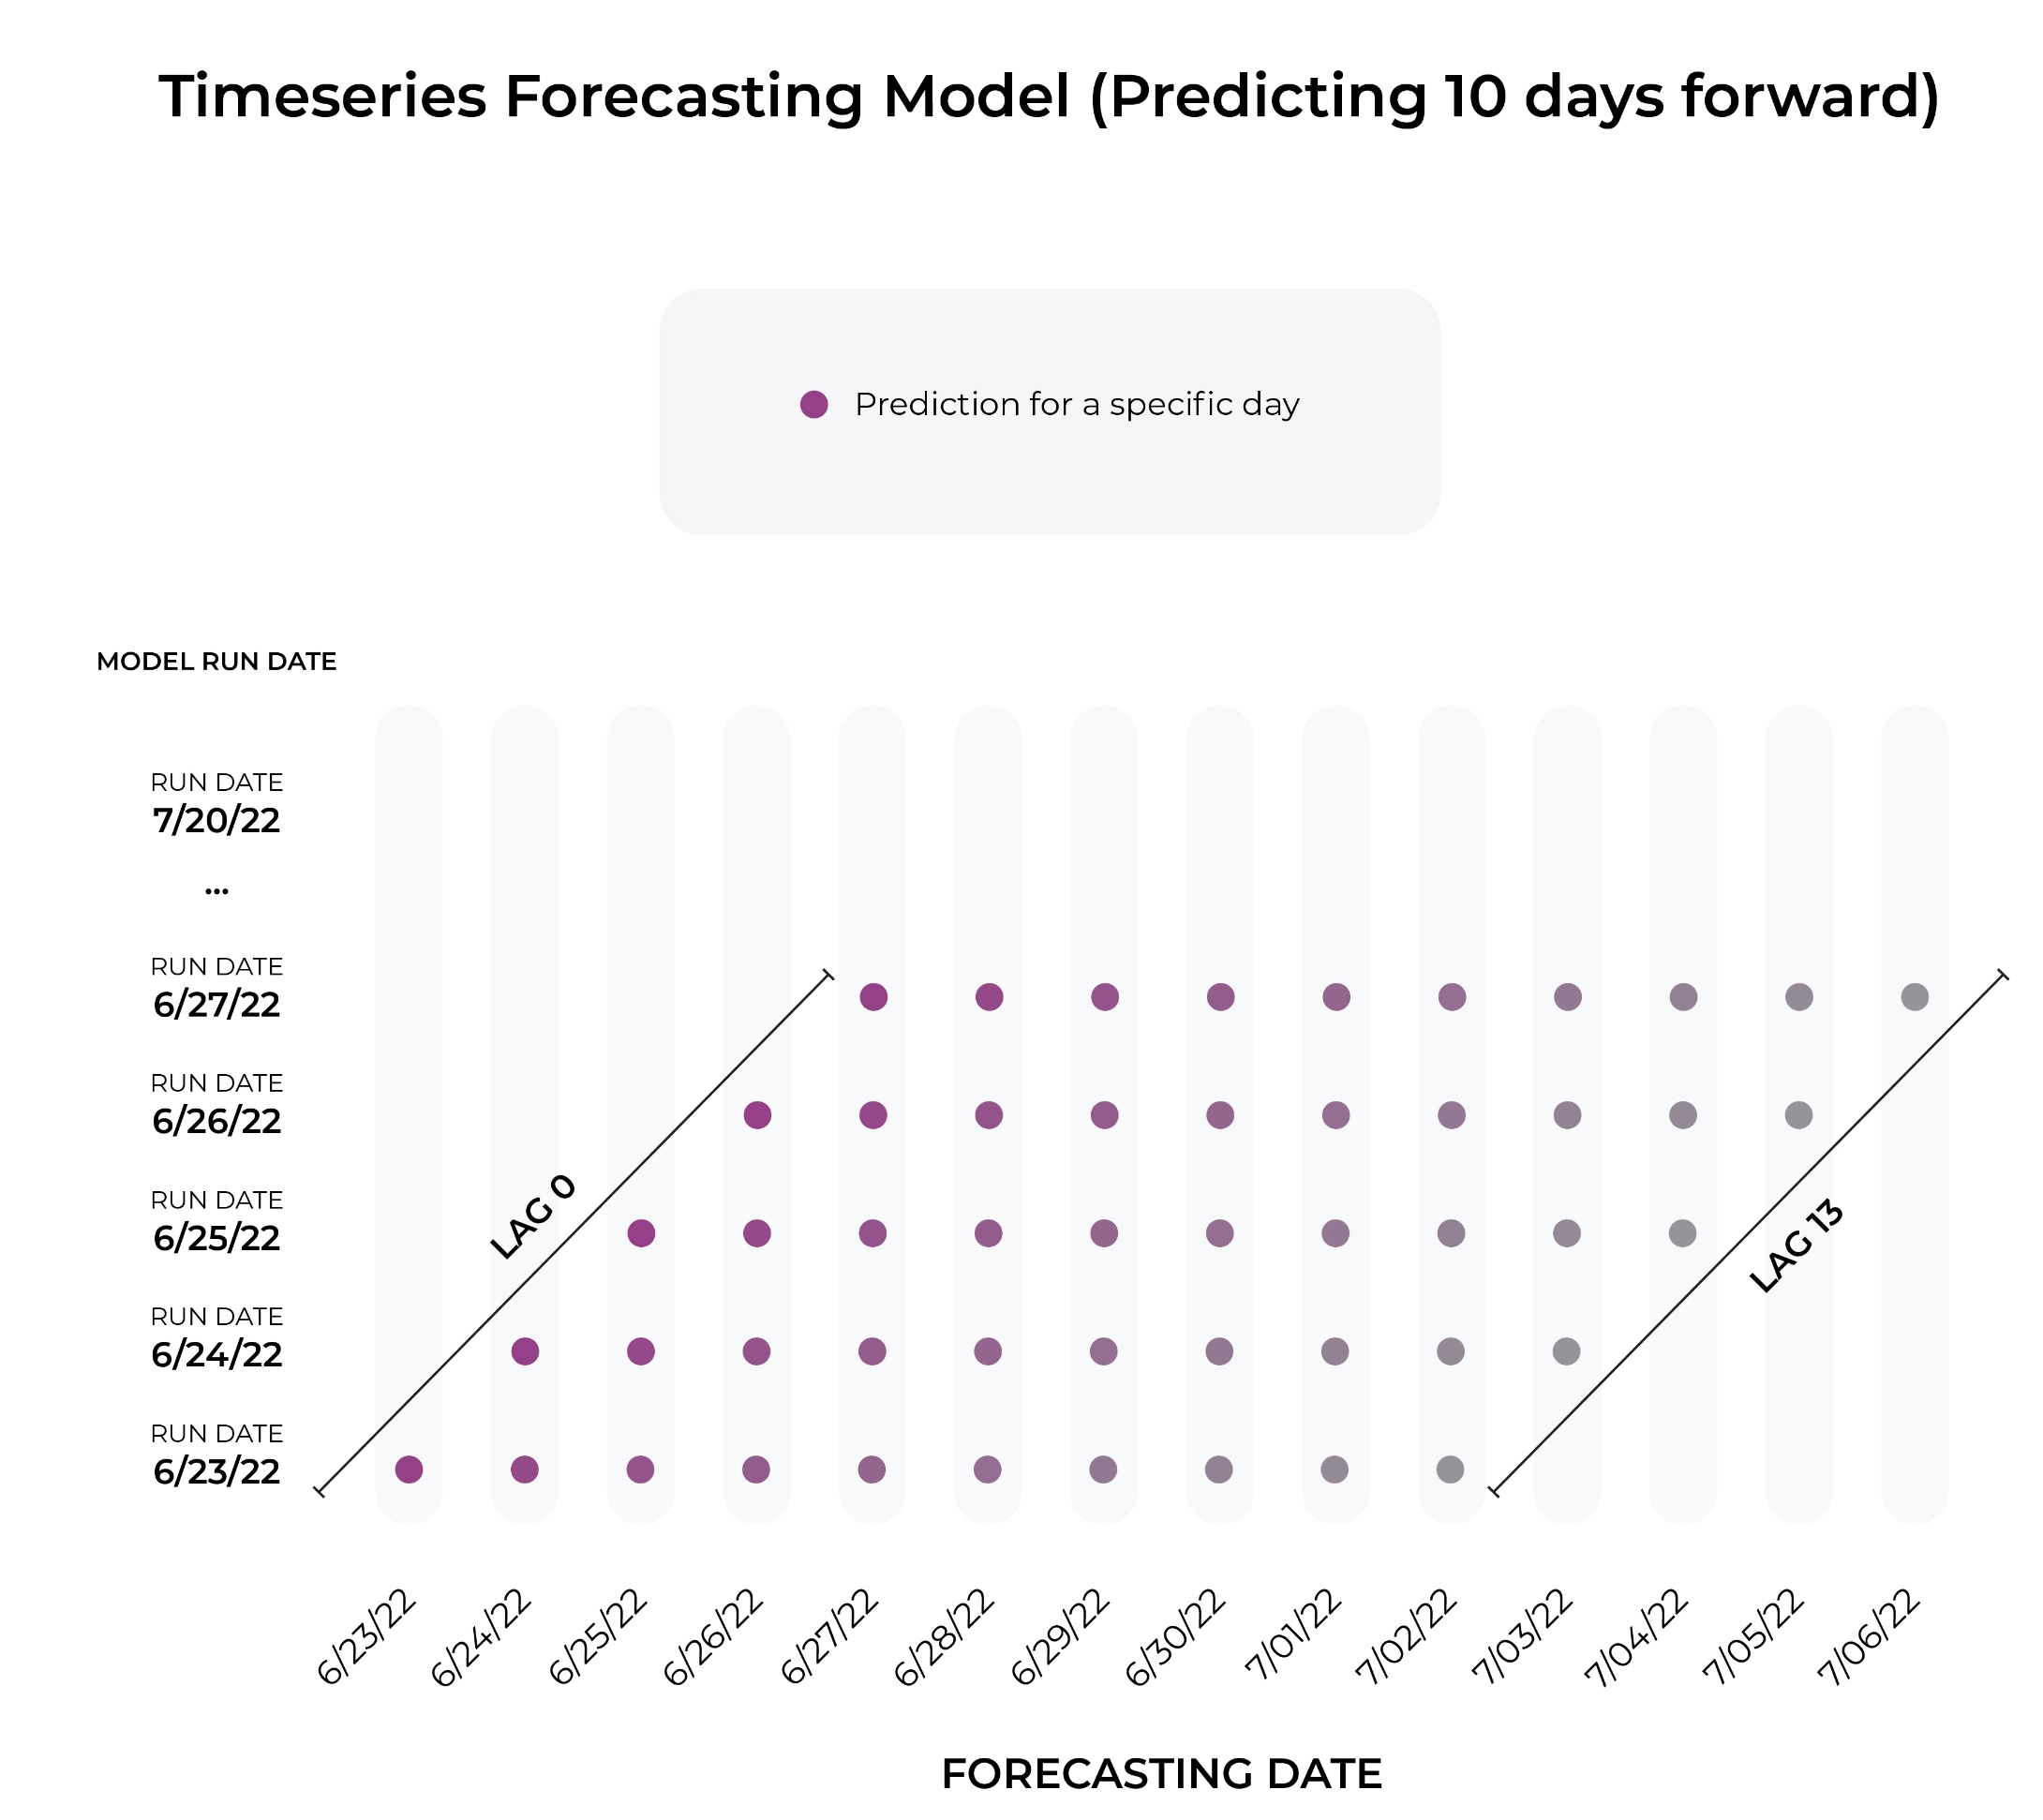
This example runs through how to setup a time series forecasting model in the Arize platform. In the timeseries forecasting use cases a model is run on specific run-date predicting data for a forecasting date in the future. This example will be predicting supply of a product from today, for each day, 10 days in the future. This setup can be modified for predicting:- End of quarter sales run every day until end of the quarter
- Predicting a single day in the future 100 days out - run every day
- Predicting sales of a product every day looking out over the next 30 days
Example of Timeseries Forecasting
Common Observability Data for Timeseries Model
The common data that is tracked for timeseries models includes:- Forecast Date: The date and time of the predicted event or observation.
- Run Date: The date on which your model ran and generated a prediction.
- Lag: The number of days between the run date and the forecast date.
Setting up TimeSeries Data
Common Performance Metrics
The common metrics for timeseries forecasting are MAPE, MAE, RMSE, MSE, R-Squared, and Mean Error, with filter options for run-date and lag. In the Arize Dashboard shown below, it’s clear that we see an over prediction event first, then an under prediction event later. We can clearly see the magnitude of these errors based on our custom configuration.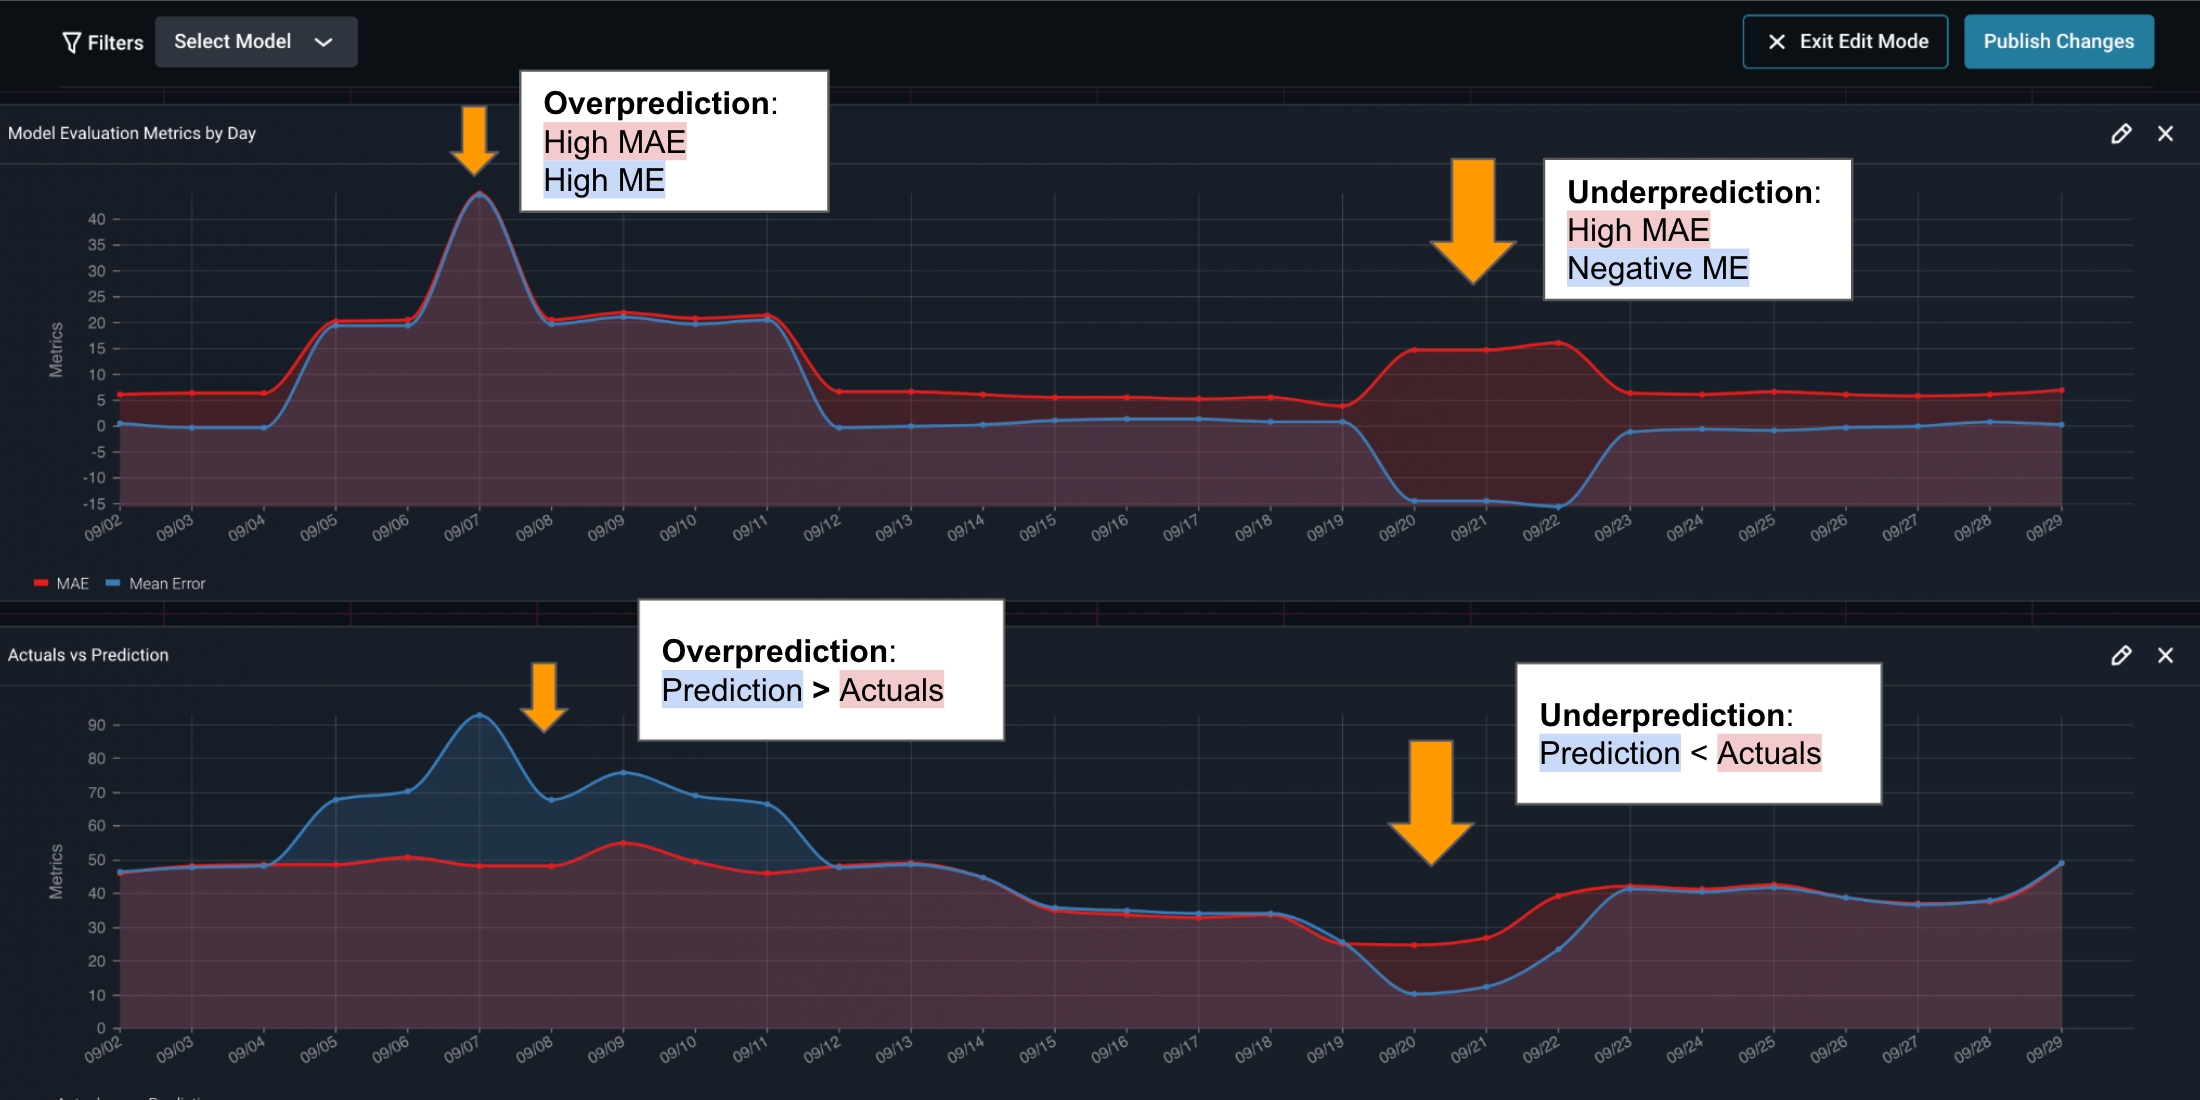
Timeseries MAPE
Schema for forecasting models
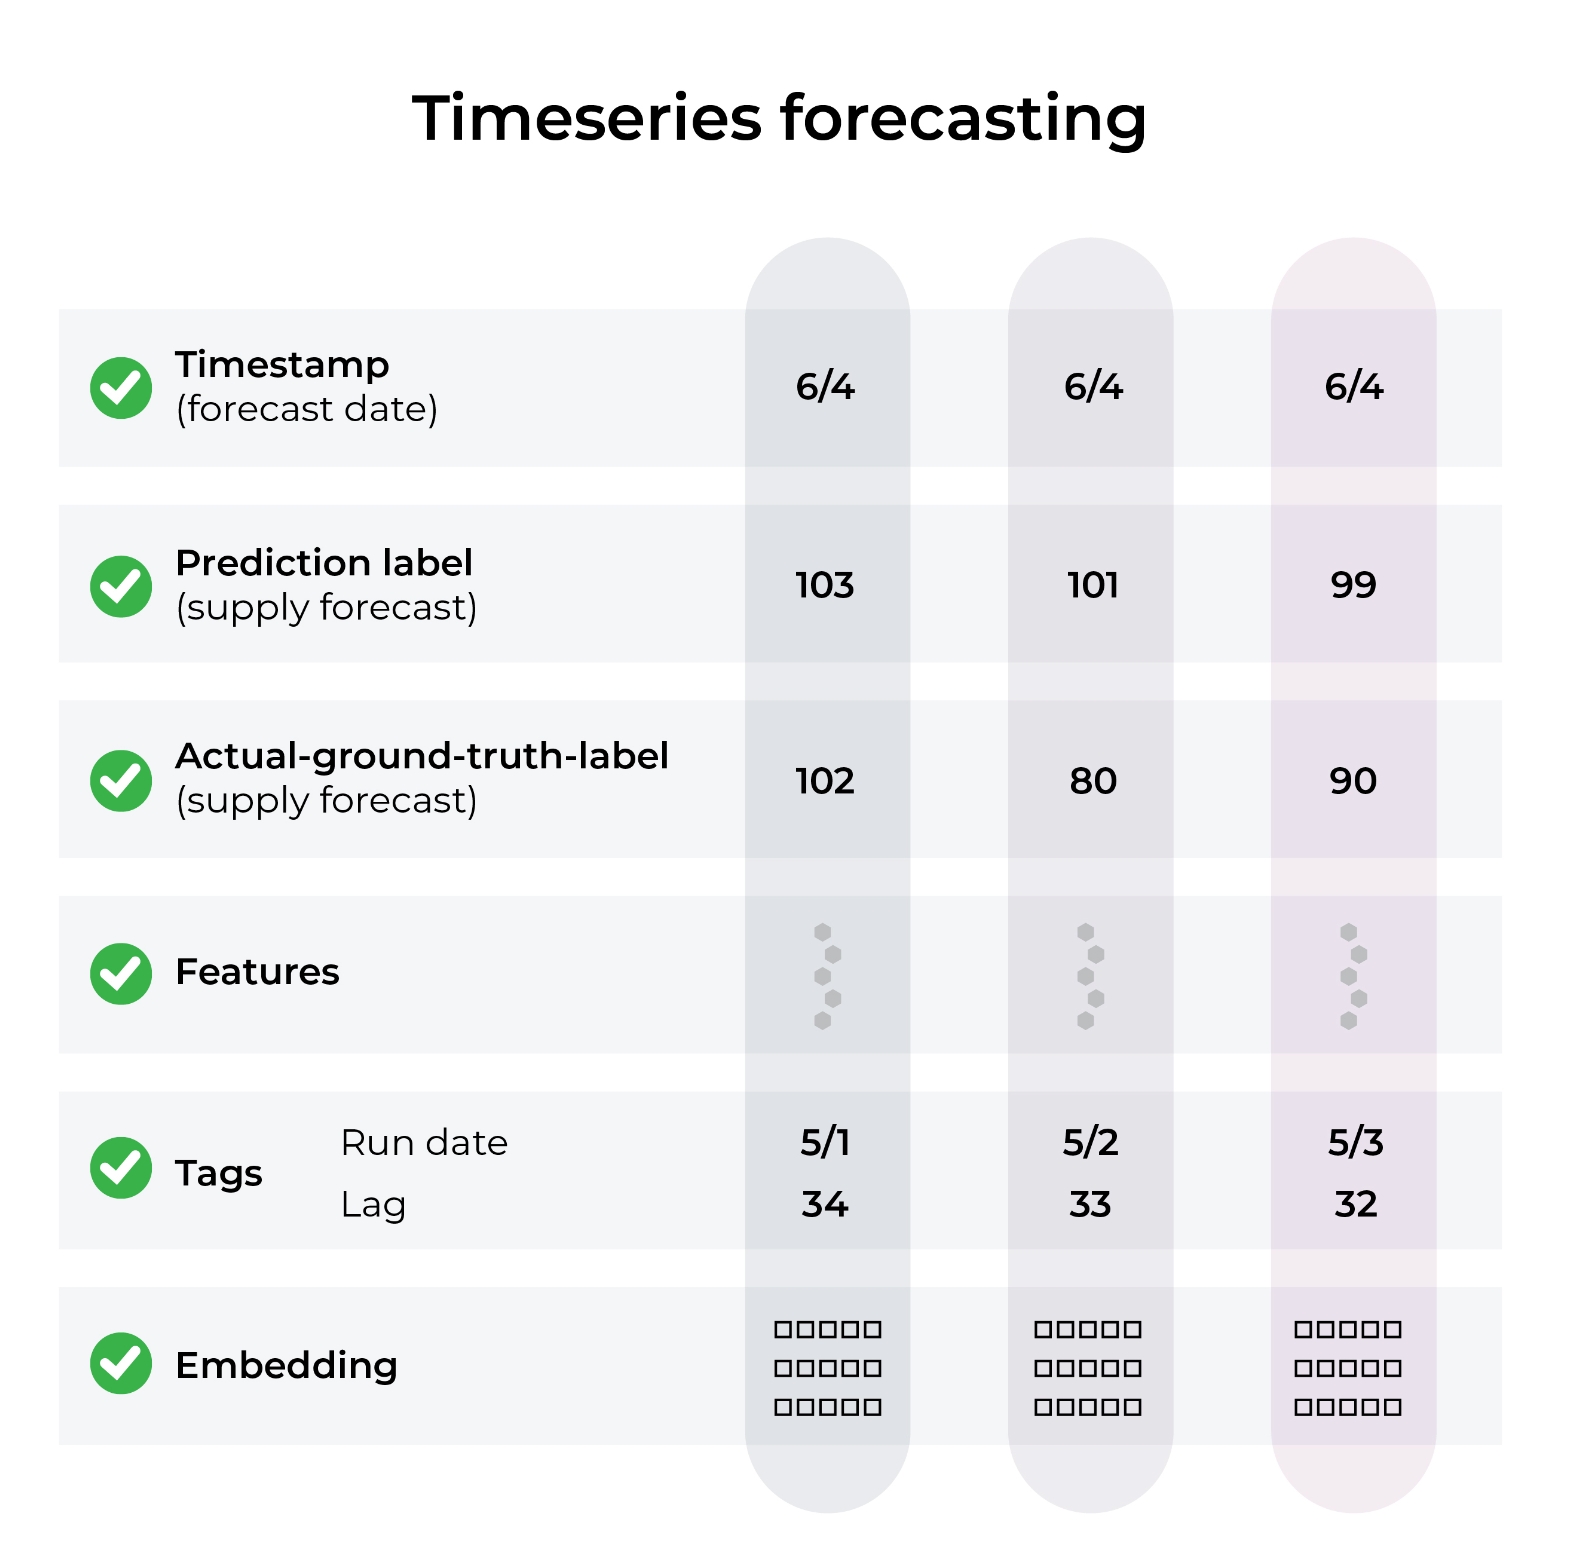
Timeseries forecasting models are characterized by three fields:- forecast timestamp: the date and time of the predicted event or observation and is passed into the timestamp field. (data type: integer unix timestamp in seconds)
- run_date: the date on which the model was run and the prediction was generated and is optionally passed in as a tag. (recommended data type: str or integer unix timestamp)
- lag: the number of days between the forecast timestamp and run date and is optionally passed in as a tag (recommended data type: int)
You will likely need to extend your model’s delayed actuals join window. Reach out to support@arize.com for help with this.
Timeseries Code Example
- Python Batch
- Python Single Record
- Data Connector

Other Examples
The Colab example below shows how a timeseries model is setup in the Arize platform.Google Colab
Google Colab