marquee background
Model drift icon

Model Drift: A Guide to Understanding Drift in AI

Your one-stop shop for all things model drift-related. Learn what constitutes model drift, how to monitor for drift in machine learning models, the types of drift -- including concept drift, feature drift, and upstream drift -- and drift resolution techniques for models with or without actuals.

What Is Model Drift?

Drift is a change in distribution over time, measured for model inputs, outputs, and actuals of a model. Model drift usually refers to a change in the model’s predictions, so what the model is predicting today is different from what it has detected in the past. While model drift specifically means drift in predictions, model drift or model decay can also include when your model makes less accurate predictions from incoming values when compared to its original prediction power before it was deployed. Other types of drift, like concept drift or data drift, are changes in actuals or in the inputs or features, respectively. Measure drift to identify if your models have grown stale, you have data quality issues, or if there are adversarial inputs in your model. Detecting drift in your models will help protect your models from performance degradation, especially where no ground truth is available or is delayed, and allow you to better understand how to begin resolution.

Why is Model Drift Important?

It’s impossible to tell how an machine learning model will perform as it transitions from the research environment to the real world. Teams are often left in the dark on whether their models will perform as expected in training or if the model’s performance will start to degrade in response to changing environments. Monitoring for drift is a key step in machine learning observability which allows teams to easily diagnose production issues that cause a negative impact on your model’s performance, especially if that model has delayed or no ground truth.


Ground Truth
arrow icon
background image
Model Drift/
Concept Drift
Outputs
background image
Model Drift/
Concept Drift
Explainability
(SHAP)
arrow icon
image model box
background image
Model Drift/
Concept Drift
Inputs
background image
Data Drift/
Feature Drift

Types of Drift

Drift measures the change between two distributions over time from training, validation, or even production data. To measure drift, statistical distance measures are used to measure the distance between them. Since drift measures a change in relationships, there are a few different types of drift to monitor in your production model. Drift monitors fall into a few main categories: prediction drift, concept drift, data drift, and upstream drift.

Prediction Drift Change in Relationships

Jump to section →
background gradient

Concept Drift Change in Actuals

Jump to section →
background gradient

Data Drift Change in Distributions

Jump to section →
background gradient

Upstream Drift Change in Data Pipeline

Jump to Section →
background gradient
What is Prediction Drift?

Prediction drift (aka model drift) represents a change in a model’s predictions over time. Prediction drift also reflects a change in predictions from new values compared to pre-production predictions. Once you know what exactly is causing the model or prediction drift, it’s possible to combat it by retraining the model with additional data or replacing the model.

Why Is Monitoring For Prediction Drift Important?

Assuming your model is deterministic, and nothing in your feature pipelines has changed, your model should give the same results if it sees the same inputs. Yet, in production, models decay over time. Monitoring for prediction drift provides insights into model quality and overall model performance.

While it would be ideal if inputs were the only thing to change in your model, and everything else remains stagnant, unfortunately, that’s not the case when a model is in production, and even if your model is making the same predictions as yesterday, it can make mistakes today!

Prediction drift can point to a degradation in your model’s performance and it’s important to catch prediction drift before your model degrades to the point of negatively impacting your customers’ experience or intended business outcomes.

ARIZE Drift Metrics

Advanced course covers common drift metrics, how they are calculated, and how to use them.

PENN ENGINEERING A Unifying View of Dataset Shift in Classification

Paper explores types of data set shift in classification, including covariate shift, prior probability shift, and concept shift.

ARIZE The Model Had Shipped, What Could Possibly Go Wrong?

A guide to model failure modes and detecting, diagnosing, and explaining regressions models that have been deployed to production. Explores model drift with examples.

ARIZE Beyond Monitoring: The Rise of Observability

Learn about ML observability, which compares distribution changes between a baseline distribution and a current distribution and how model owners can do targeted upsampling when there is drift.

ARIZE When I Drift, You Drift, We Drift

A quick guide with basketball metaphors on the different types of drift and what drift means in the context of ML observability

ARIZE A Guide To Statistical Distance Measures

Use cases for statistical distance checks and model drift across model inputs, model outputs and actuals.
What Is Concept Drift?

Concept drift refers to a drift in actuals, or a shift in the statistical properties of the target or dependent variable(s). Specifically, this means the current ground truths have drifted from previous ground truths (based on prior time periods or older data training sets). To state it another way, concept drift signifies a fundamental change in the relationship between current actuals and actuals from a previous time period.

Why is Measuring for Concept Drift Important?

Monitoring for concept drift helps ensure models are accurate and relevant in the real world.

As it stands, predictive models assume a static relationship between input and output variables. As data changes over time, there is a hidden layer of subliminal data that an ML model can have trouble accounting for. There are a few areas of emphasis within concept drift such as:

  • A gradual change over time
  • A recurring or cyclical change
  • A sudden or abrupt change

Not accounting for the changing underlying relationships between inputs and outputs can severely degrade models in production. Monitor for concept drift to better understand when to refit or update your model, weight data appropriately, and prepare data to account for concept drift.

CORNELL UNIVERSITY Learning Under Concept Drift: A Review

Frameworks and datasets for evaluating the performance of machine learning models to handle concept drift.

EINDHOVEN UNIVERSITY A Survey on Concept Drift Adaptation

A comprehensive introduction to the concept drift adaptation for researchers, industry analysts and practitioners

CORNELL UNIVERSITY Characterizing Concept Drift

A comprehensive framework for quantitative analysis of drift, including an early comprehensive set of formal definitions of types of concept drift.

CORNELL UNIVERSITY Understanding Concept Drift

Quantitative drift analysis techniques along with methods for communicating their results and real-world examples.

ARIZE Navigating the Different Types of Drift

An easy-to-understand primer on different drift types, including concept drift.

CITESEERX The Problem of Concept Drift: Definitions and Related Work

Different types of concept drift with all of its peculiarities and a review of prevailing approaches to concept drift.

What is Data Drift?

Data Drift (aka feature drift, covariate drift, and input drift) refers to a distribution change associated with the inputs of a model. This means there is a shift in the statistical properties of the independent variable(s), a drift in the correlations between variables and feature distributions. This particular type of drift can be caused by changes in customer preferences, seasonality, the addition of new offerings, or other factors.

Why is Monitoring for Data Drift Important?

The world is constantly changing, inputs are not static, and data drift is inevitable. Change in the input to the model is almost inevitable, and your model can’t always handle this change gracefully. Some models are resilient to minor changes in input distributions; however, as these distributions stray far from what the model saw in training, model performance inevitably suffers.
Monitoring for data drift helps easily catch and resolve performance issues quickly.
As ML models are highly dependent on the data they are trained on, the data used to train a model offline needs to stay as relevant as possible. Especially in hyper-growth businesses where data is constantly evolving, accounting for model drift is important to ensure your models stay relevant.
Monitoring feature drift catches input problems that can negatively affect your model’s overall performance and ensure your models have not grown stale.

ARIZE Understanding Drift

Covers why you need to monitor data drift and use cases along with the tradeoffs between different prevailing statistical distance metrics across both structured and unstructured data.

CORNELL UNIVERSITY Analysis of Drifting Features

Paper analyzing methods for identifying of model features that are most relevant for observed feature drift

MDPI Adaptive Quick Reduct For Drifting Features

Presents a variation of the QuickReduct algorithm to dynamically select the relevant features in the stream.

MIT PRESS Dataset Shift in Machine Learning

Highlights prevailing ways for dealing with data and covariate shift, which occurs when test and training inputs and outputs have different distributions.

ARIZE Take my Drift Away

Piece co-written with Delta Air Lines on what drift is, why it’s important to keep tabs on, and how to troubleshoot and resolve the underlying issue when drift occurs.

ARIZE A Quick Start To Data Quality Monitoring For Machine Learning

Dealing with cardinality shifts, missing data, type mismatch, out of range violations and more

What is Upstream Drift?

Upstream Drift (aka operational data drift) refers to drift caused by changes in a model’s data pipeline.

Why is Monitoring for Upstream Drift Important?

Inputs can be imperfect: they can be mislabeled, wrongly categorized, or have other deviations from your training environment. Upstream drift issues are hard to detect since there could be other issues that affect your model’s performance, and upstream issues are not as obvious to look for.

Upstream drift can occur because of missing values or changes in a feature’s cardinality, which can negatively affect your model’s overall performance in production. Monitoring and addressing upstream drift can help manage hard to detect performance problems as a model moves from research to production.

ARIZE A Guide for Troubleshooting Drift

A practical guide for measuring drift and knowing when to retrain your model

Google Cloud Analyzing Training-Serving Skew

A useful guide to identifying data skews and anomalies

Cornell University Detection of Data Drift and Outliers Affecting Machine Learning Model Performance Over Time

Detecting drift indirectly by nonparametrically testing the distribution of model prediction confidence for changes.

How to Measure Model Drift Metrics

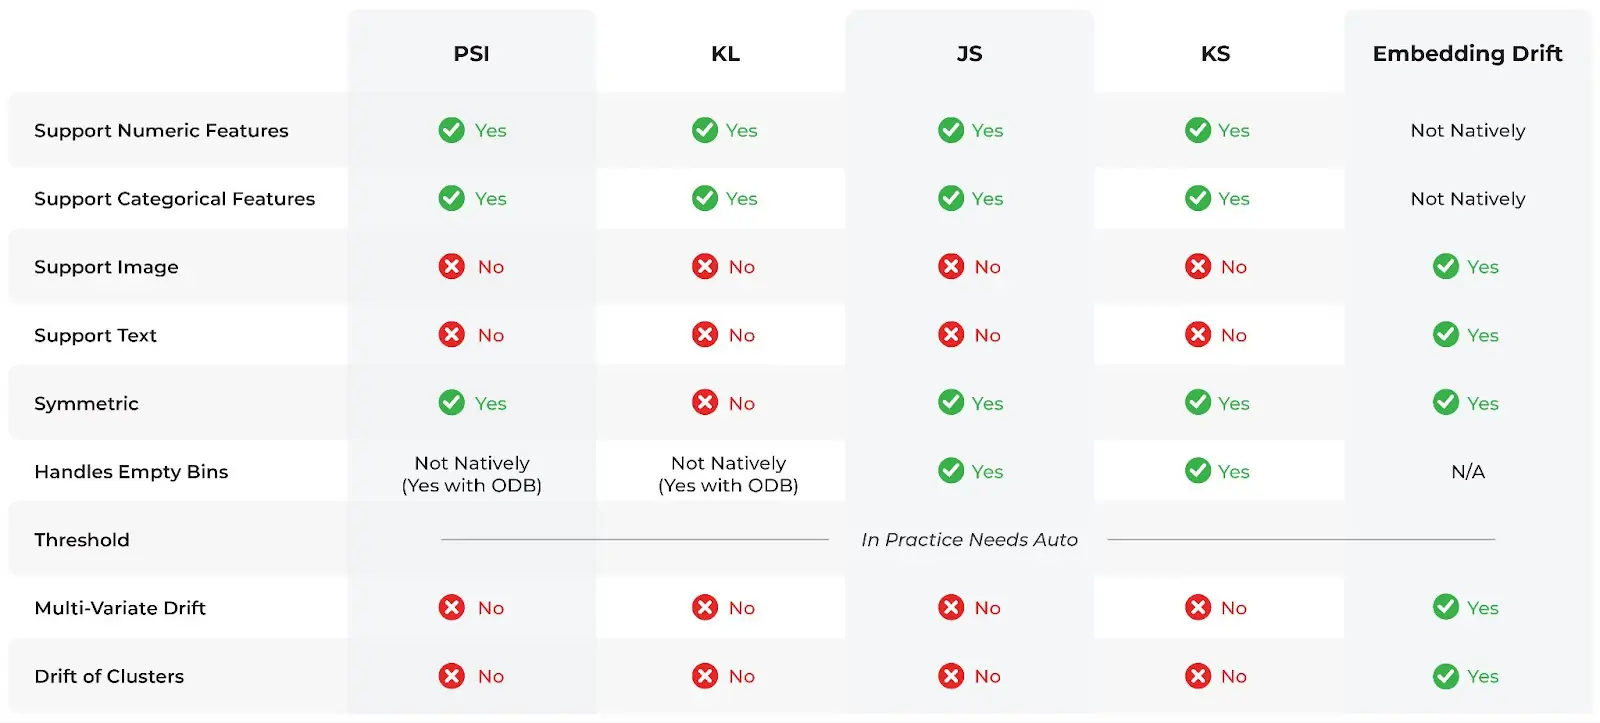
Drift is largely measured by comparing the distributions of the inputs, outputs, and actuals between training and production. Model drift metrics are not one-size-fits-all and vary depending on your use case.

But how do you actually quantify the distance between these distributions? For that, we have distribution distance measures.

drift metrics and statistical distance checks when to use each

To name a few, we have:

  1. Population Stability Index (PSI): Population Stability Index looks at the magnitude which a variable has changed or shifted in distribution between two samples over the course of a given time. PSI is calculated as: PSI = (% Actual – % Expected) x ln(% Actual / % Expected).
  2. Kullback — Leibler divergence (KL divergence): The Kullback-Leibler Divergence metric is calculated as the difference between one probability distribution from a reference probability distribution. KL divergence is sometimes referred to as ‘relative entropy’ and best used when one distribution is much smaller in sample and has a large variance.
  3. Jensen Shannon divergence: Jensen-Shannon is an asymmetric metric that measures the relative entropy or difference in information represented by two distributions. The advantage of JS divergence over other metrics is mostly related to issues with empty probabilities for certain events or bins and how these cause issues with KL divergence and PSI.
  4. Wasserstein’s Distance: The distance between two probability distributions over a given region or area.
  5. Euclidean Distance: The simple euclidean distance check determines if the group of production data’s average centroid has moved away from the baseline group

While each of these distribution distance measures differs in how they compute distance, they fundamentally provide a way to quantify how different two statistical distributions are.

This is useful because you can’t build a drift monitoring system by looking at squiggles on charts. It would be best if you had an objective, quantifiable ways of measuring how the distribution of your inputs, outputs, and actuals are changing over time.

Arize Embedding/Vector Drift

Dives into approaches for measuring embedding/vector drift for unstructured data — including for computer vision and large language models.

Arize Using Statistical Distances In Machine Learning

Best practices for when and how to use specific statistical distance metrics to monitor and troubleshoot drift, including population stability index (PSI), Kullback–Leibler divergence (KL-Divergence), Jensen–Shannon divergence (JS-Divergence) and Earth Mover’s Distance (EMD)

Arize Kolmogorov-Smirnov (K-S) Test

A nonparametric test that compares the cumulative distributions of two data sets. The null hypothesis for this test states that the distributions from both datasets are identical. If the null is rejected then you can conclude that your model has drifted.

Arize Population Stability Index (PSI)

A metric used to measure how a variable’s distribution has changed over time. It is a popular metric used for monitoring model drift as it measures changes in the characteristics of a population, and thus, detecting model decay.

O'REILLY Z-Score

A comparison metric to measure the feature distribution between the training and live data. For example, if a number of live data points of a given variable have a z-score of +/- 3, the distribution of the variable may have shifted.

Arize K-L Divergence

A measure of how one probability distribution is different from a second, reference probability distribution, used to detect model drift when one distribution is much smaller in sample numbers and has a large variance.

Sign up for our monthly newsletter, The Drift.

Subscribe