


Data drift in unstructured data like images is complicated to measure. The measures typically used for drift in structured data – such as population stability index (PSI), Kullback-Leibler divergence (KL divergence), and Jensen-Shannon divergence (JS divergence) – allow for statistical analysis on structured labels, but do not extend to unstructured data. The general challenge with measuring unstructured data drift is that you need to understand the change in relationships inside the unstructured data itself. In short, you need to understand the data in a deeper way before you can understand drift.
The goal of unstructured drift is to detect whether two unstructured datasets are different — and, if so, to give workflows to understand why the datasets are different. This piece recommends a global measure and method for unstructured drift. Once drift detection occurs, the root cause workflows used to troubleshoot are covered in previous articles.
What Does Drift In Unstructured Data Mean?
Image Drift
When teams highlight problems in image data, there is often a wide variation of issues that exist. These issues include blurry, spotted, lightened, darkened, rotated, and cropped images.
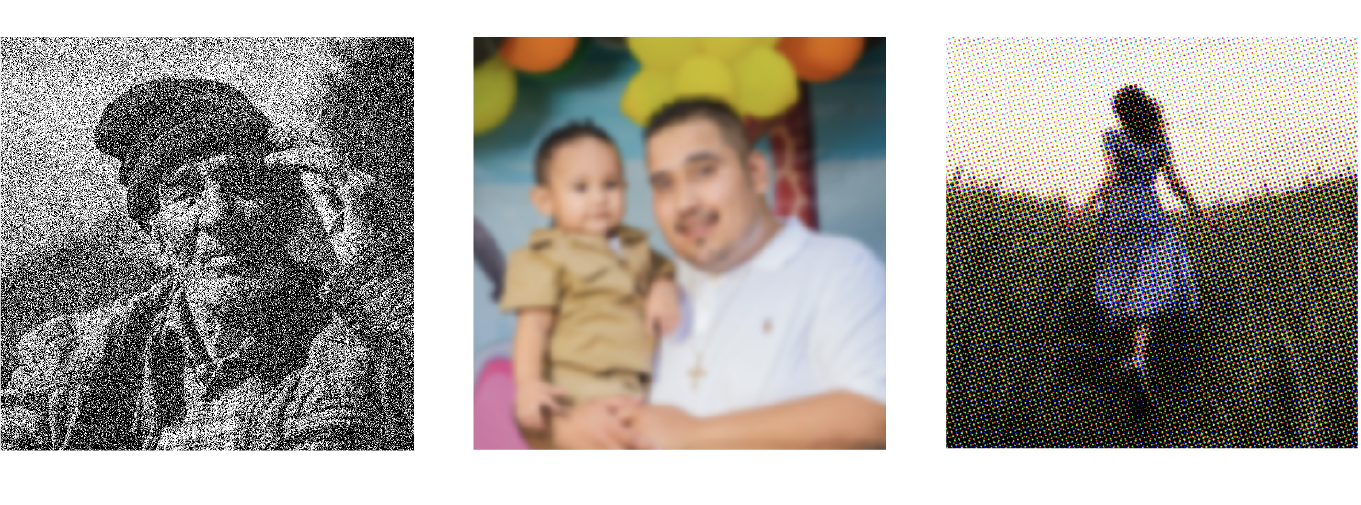
Darkened, blurred, or spotted image issues
Of course, challenges with images used for computer vision models come in all shapes and sizes. To solve them, you need an approach where you don’t need to know a-priori all combinations of issues that you need to detect because it’s often impossible to know in practice.
One of the more common data drift occurrences that teams want to detect has nothing to do with image quality issues – it’s actually finding examples of objects that were not in the original training set. What are the unique situations, events, people or objects that are observed in production data that are missing from the training set?
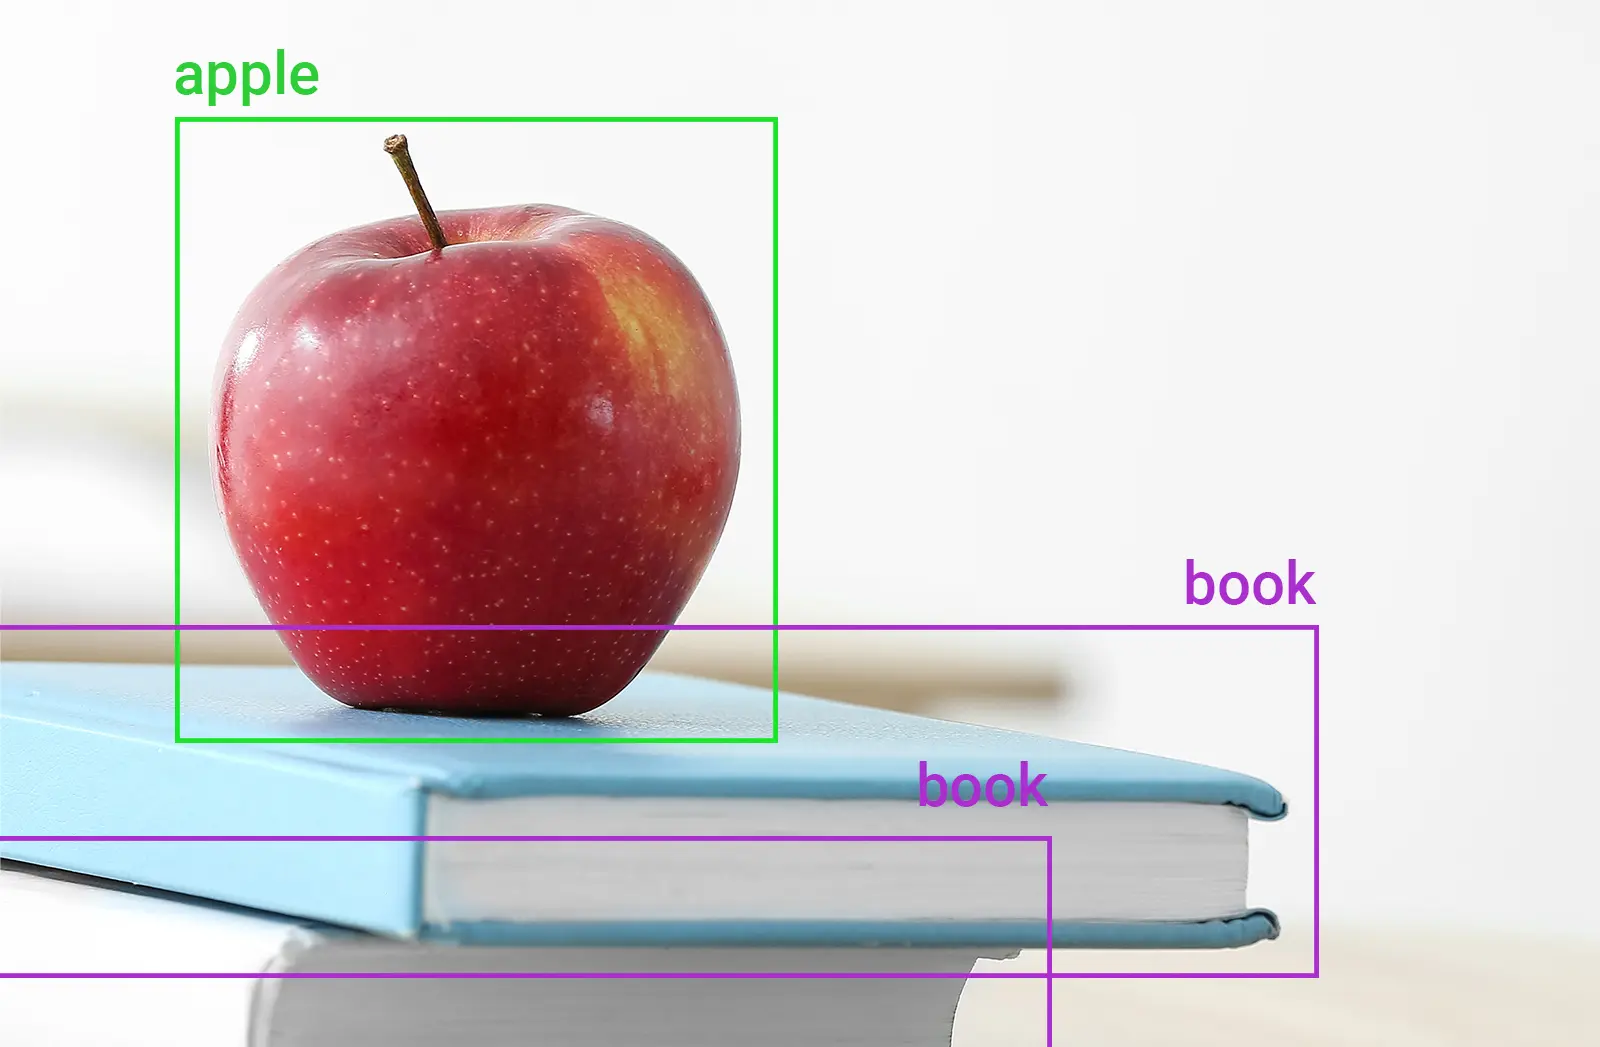
A single apple from the training set
For example, the training set might include pictures of a single apple but not pictures of multiple apples or other fruit.
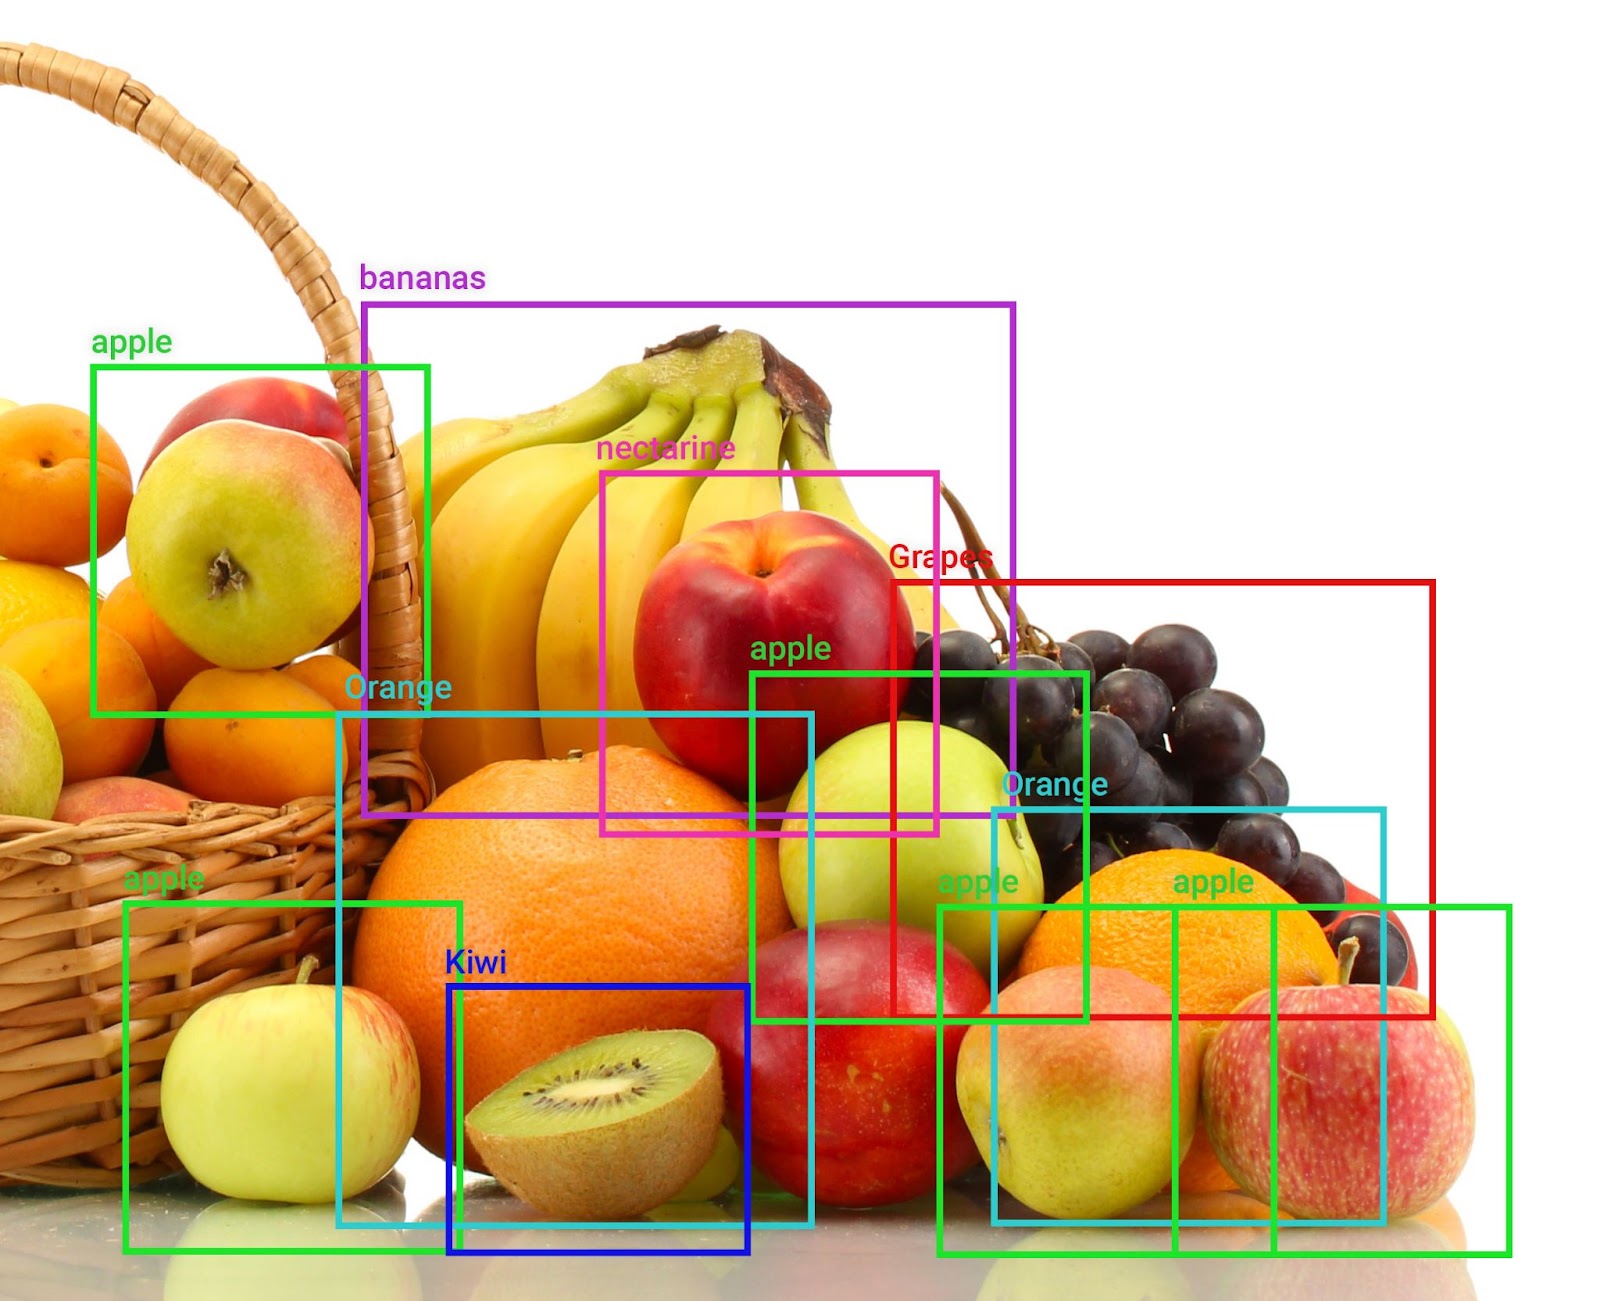
Multiple apples and a mix of fruit seen in production
Compared to the first picture, the fruit basket above includes quite a lot of other relationships and objects. If the original training set only includes pictures of apples by themselves, a picture like the above might cause problems with the model.
Text Drift
Given the constantly-evolving nature of language, potential issues with natural language processing (NLP) models are similarly diverse. Any changes in terminology in the data or changes to the context or meaning of words or phrases over time, for example, can contribute to drift. Low-resource languages and cultural gaps in speech can also compound these difficulties for ML teams.
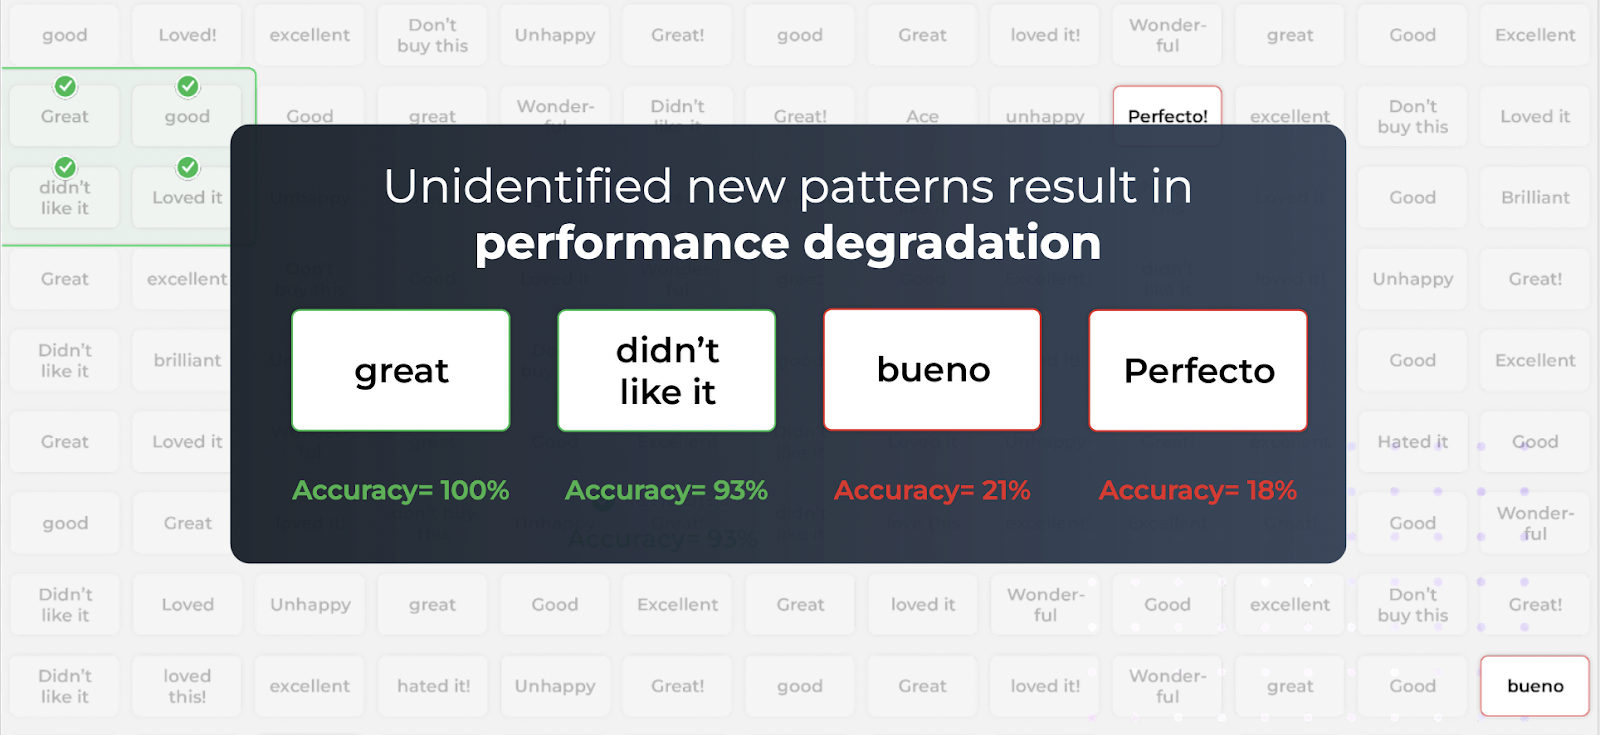
One of the most common scenarios for text drift is when a word, category or language that does not exist in the training data emerges in production. For example, a sentiment classification model trained on millions of apparel product reviews in English might decline in performance if it encounters reviews in Spanish for the first time in production. Such a model would also struggle if suddenly it is asked to predict, for example, the sentiment of reviews of specialized medical devices.
Extracting Embeddings
In order to understand all of the structural relationships and monitor when they change, we need to make use of embeddings that capture the latent structure in unstructured data.
An embedding can be thought of as a vector representing latent structure that is learned over unstructured data.
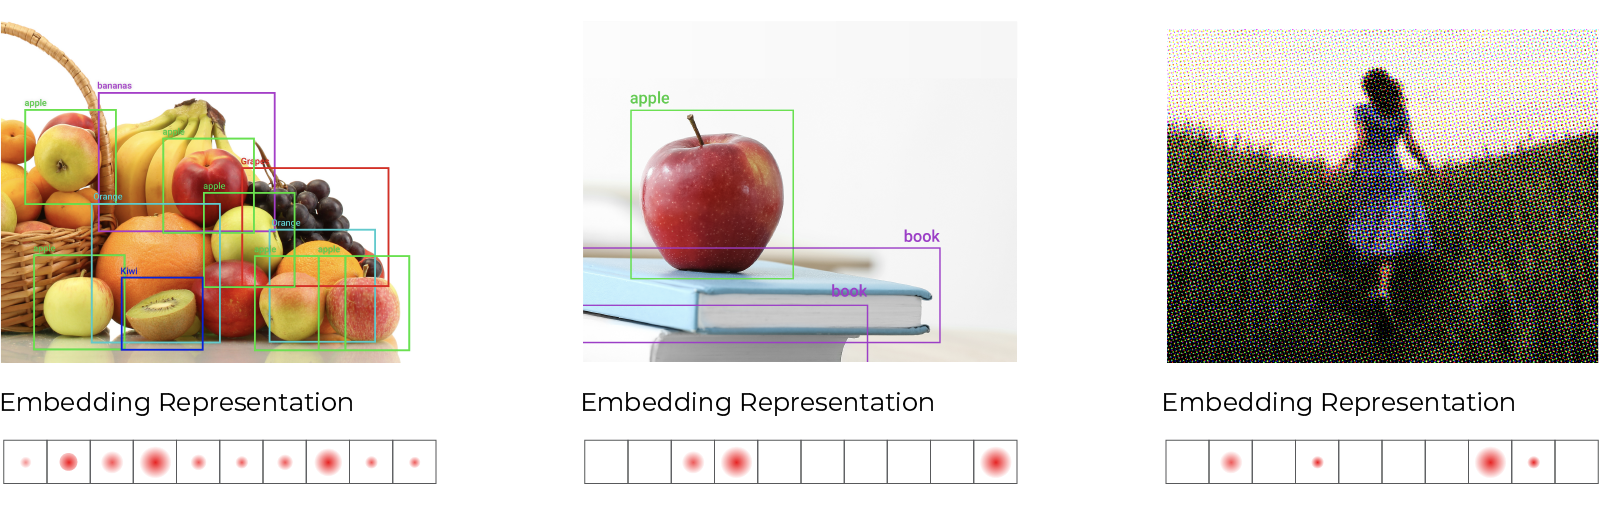
A group of embeddings, where each embedding represents an image or prediction, maps out a surface (manifold) in the high dimensional space.
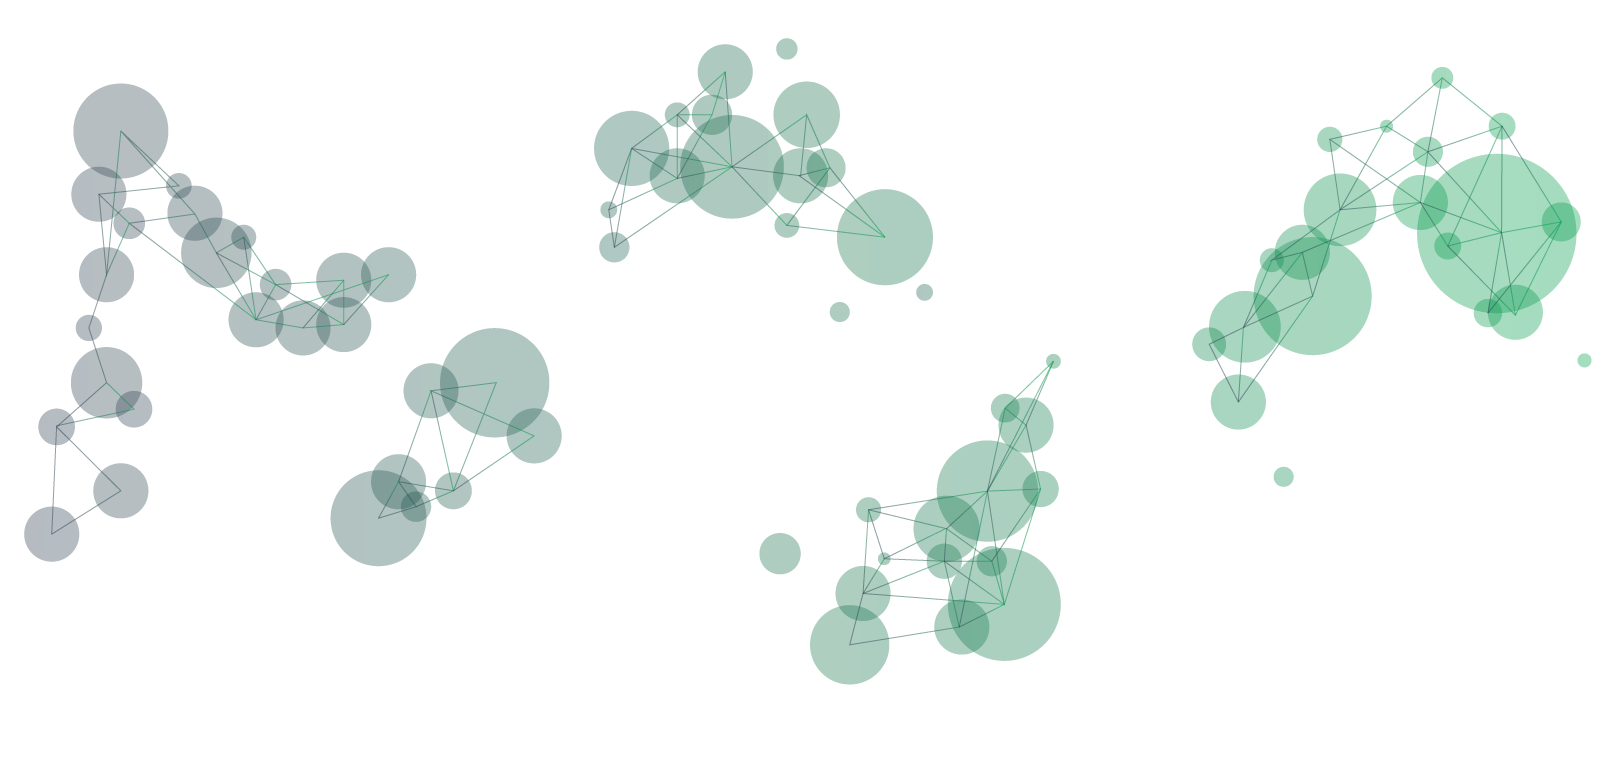
The above example shows the surfaces and relationships represented by high dimensional vector data. Images that have apples will have relationships with other images that have apples. Images that have multiple fruits will have relationships to both the apple and images with other fruits. They will be close to each other in the high dimensional space.
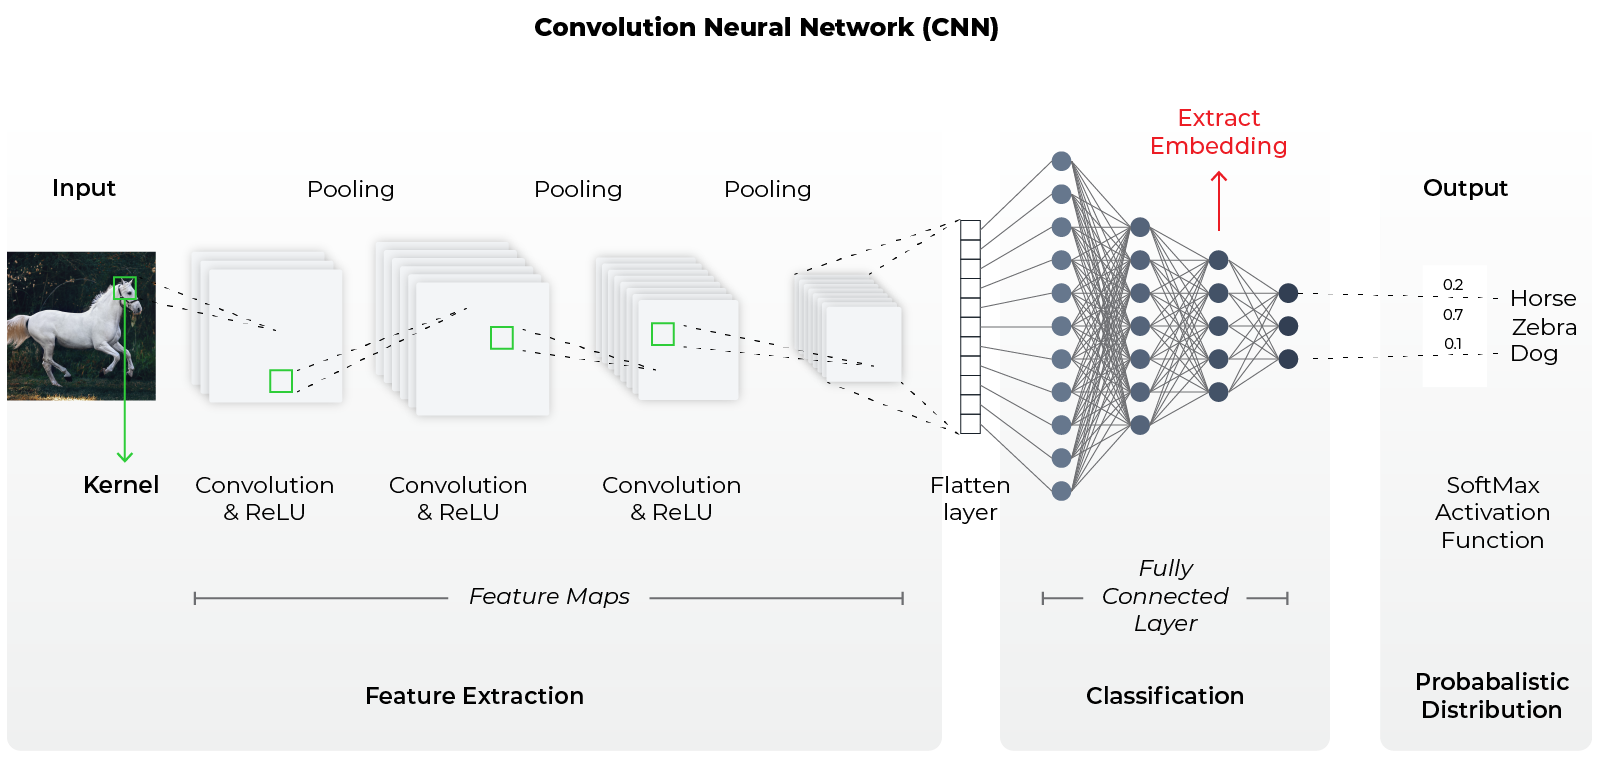
As one gets deeper in a convolutional neural network (CNN), the embeddings represent complex combinations of features or information inside the image. The embeddings contain all the information needed to make a decision about structure of the image, from blurriness to object presence.
From there, it is easy to extract an embedding from any neural network.
Case #1: Have the Model
The ideal case is the team has access to the original model and can extract an embedding in production for observability. In this case, an embedding is extracted from the current model in production. The advantage of this approach is the monitoring occurs on structure observed internally in the model, so it’s more likely to catch if the model is going to have an issue on the data or not.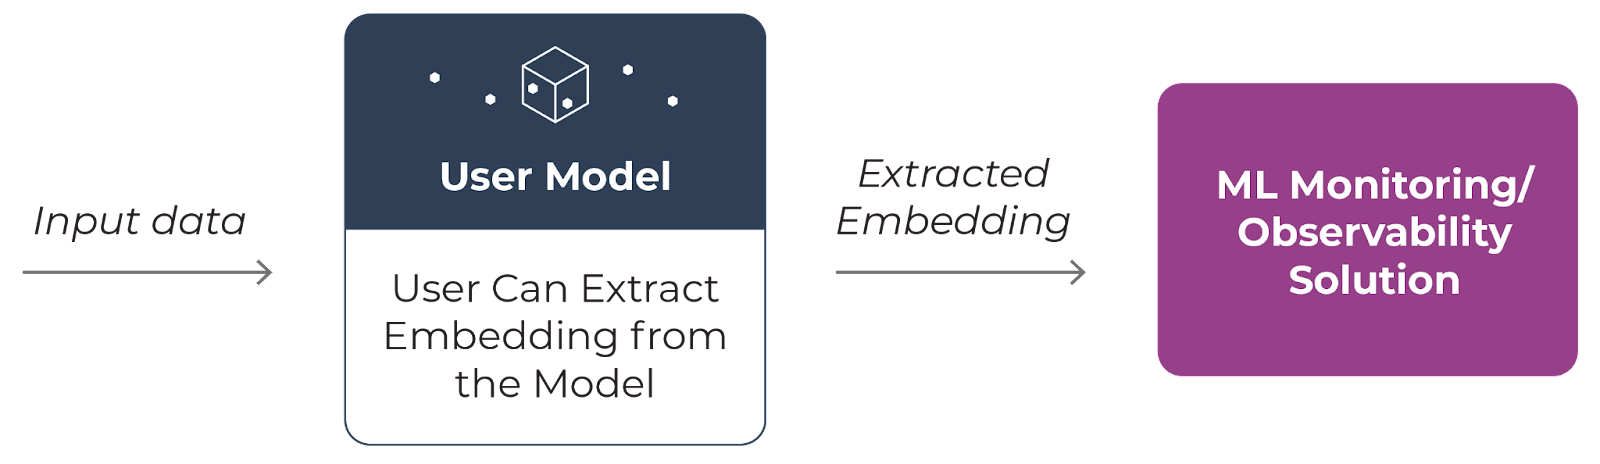
Option 1: extract embedding from model
In the case of embedding drift analysis, extracting the last fully connected layer before the classification to create an image embedding is advisable. It is the layer that includes all the compounded latent structure information to make image-level decisions, for example. The latent structure will contain information about structure in the image such as objects and actions, in addition to general quality information relative to images in the training set.
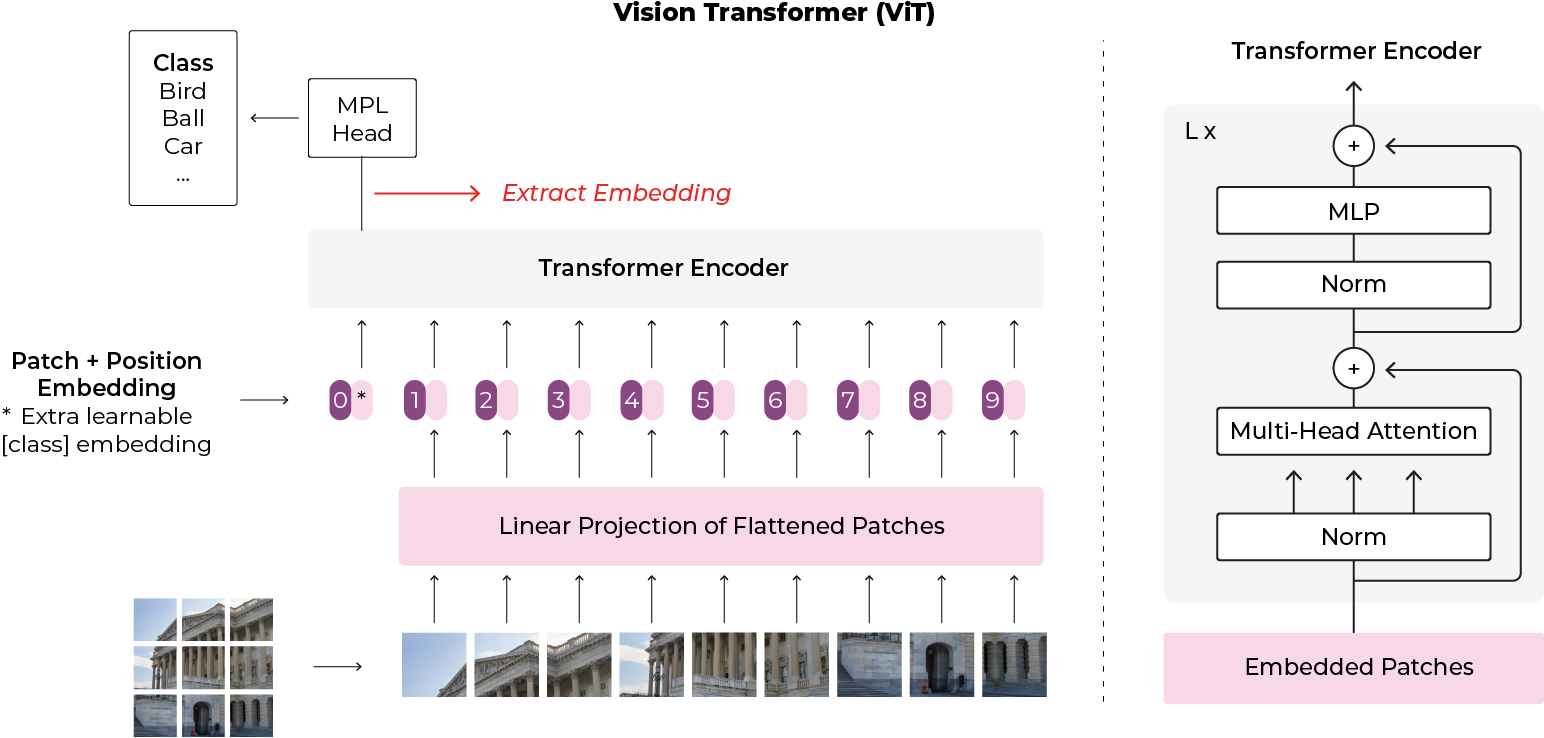
In the case of a vision transformer (ViT), it is recommended that you extract the embedding that the multilayer perceptron (MLP) is acting on to make an image-level decision. For an example on how to extract embeddings from a well-known Hugging Face model, here’s a step-by-step guide.
Case #2: Using a Global Model
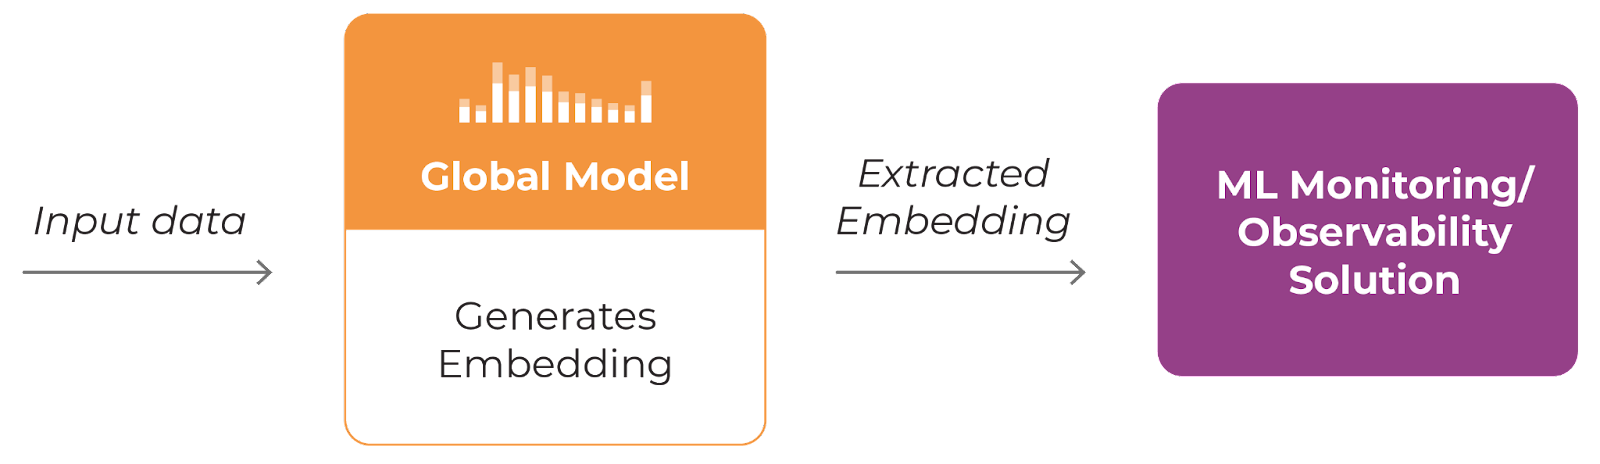
Option 2: extract embedding from data
A second option is to use a global, pre-trained model to extract the embedding from the data. Using a foundational model like BERT to extract embeddings is advantageous in that no modification is needed on the production model. It’s also an easy option for testing and running on internal data. One disadvantage is that it is only looking at the data itself and is not looking at the internal model decisions.
Once we have generated embeddings, we can now look at embedding drift metrics to compare groups of embeddings to understand how they have drifted as a group.
Embedding Drift Metrics
Comparing embeddings between different periods of time is how we detect if drift has happened and where it has occurred.
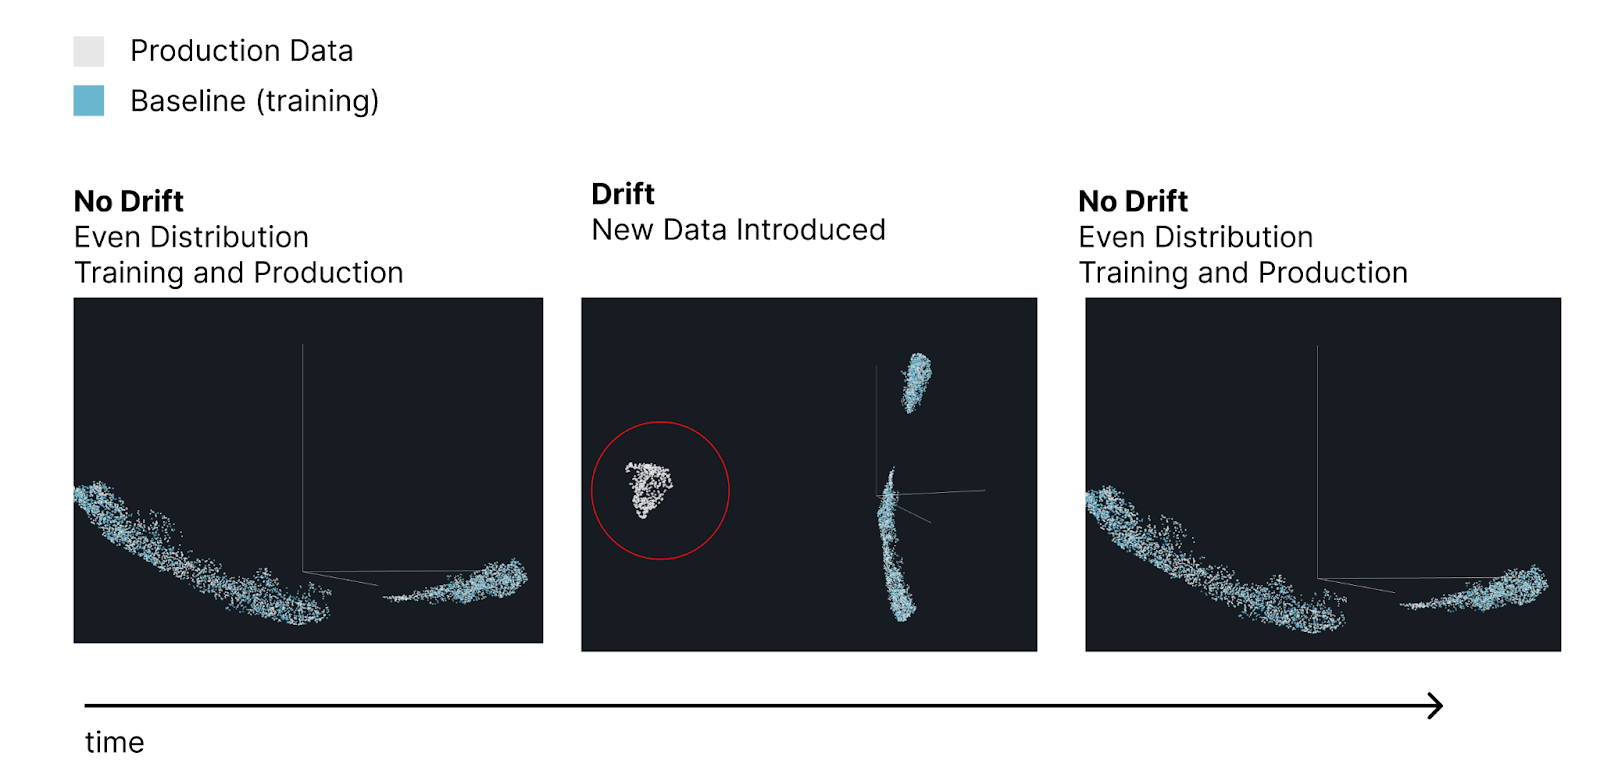
Embedding drift – new data introduced
In the example above, the gray points are predictions in the production environment while the blue points are in training. One can see the points overlap fairly closely in periods that are similar between training and production. In this example a new set of problematic data (blurred images) is added to the dataset, producing a set of predictions very different from the rest.
There are a number of drift measures that can be applied to embeddings. These include hyperbox IOU, euclidean distance, cosine distance, and clustering-based group purity scores. In this piece, we will deep dive into euclidean and cosine distance and their efficacy.
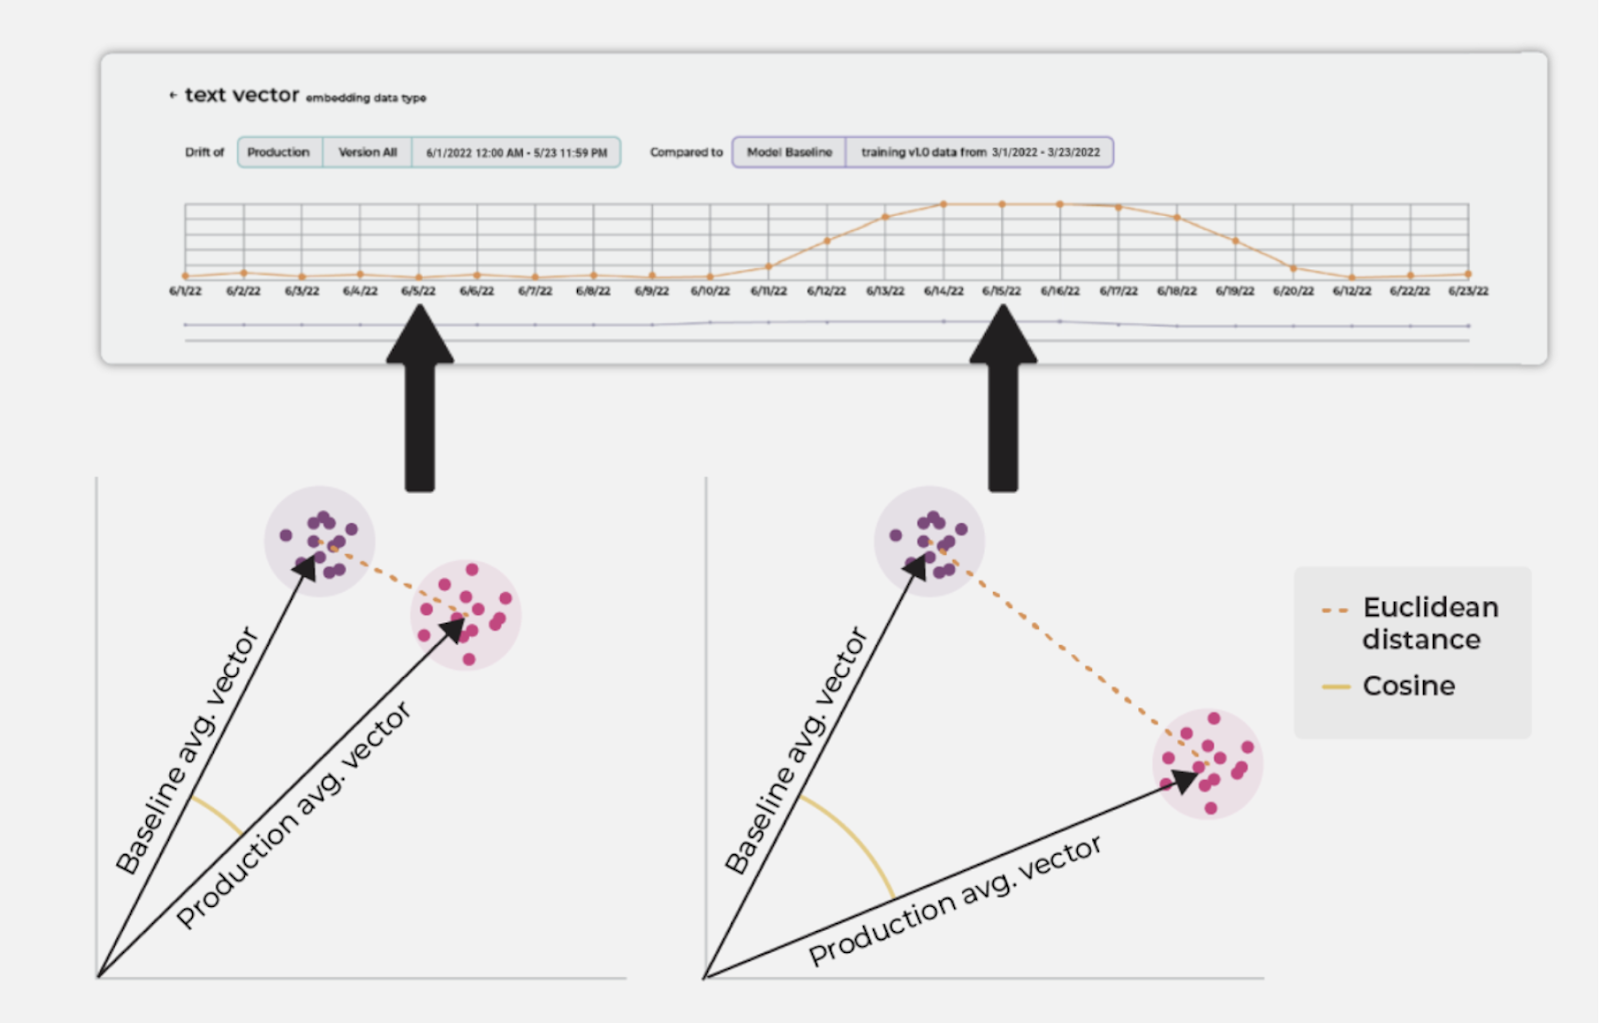
The above picture shows two groups of vectors –- one for the baseline, and the other for production. Both euclidean and cosine distances are greater when the two vectors are further apart. This is monitored as the embedding drift.
Euclidean Distance Formula
The simple euclidean distance check determines if the group of production data’s average centroid has moved away from the baseline group.
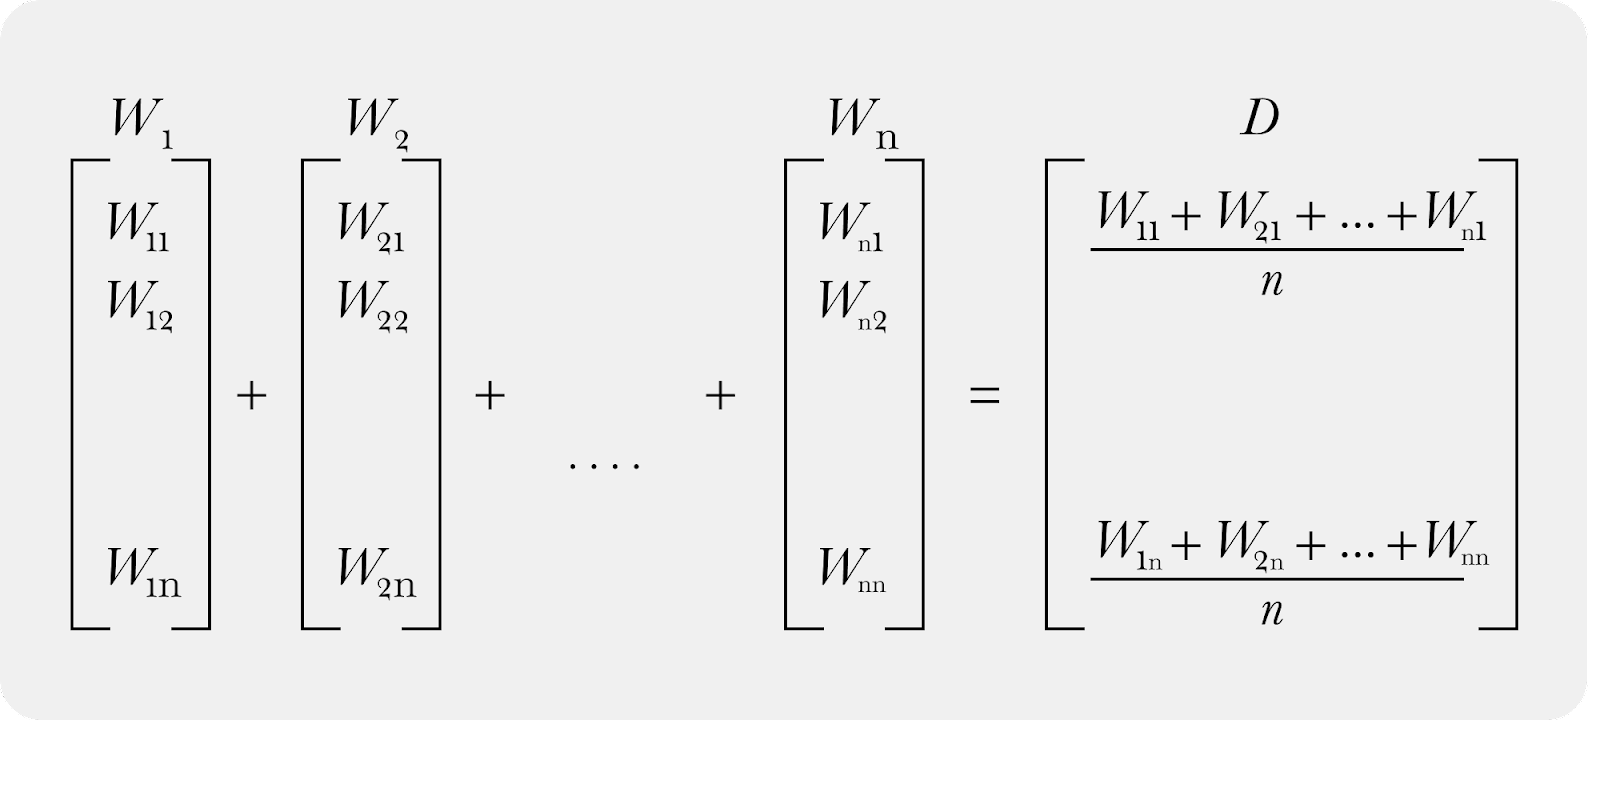
Embedding average and centroid
The above calculation would represent a single group of data (i.e. a production vector), summing all the vectors, and creating a centroid.
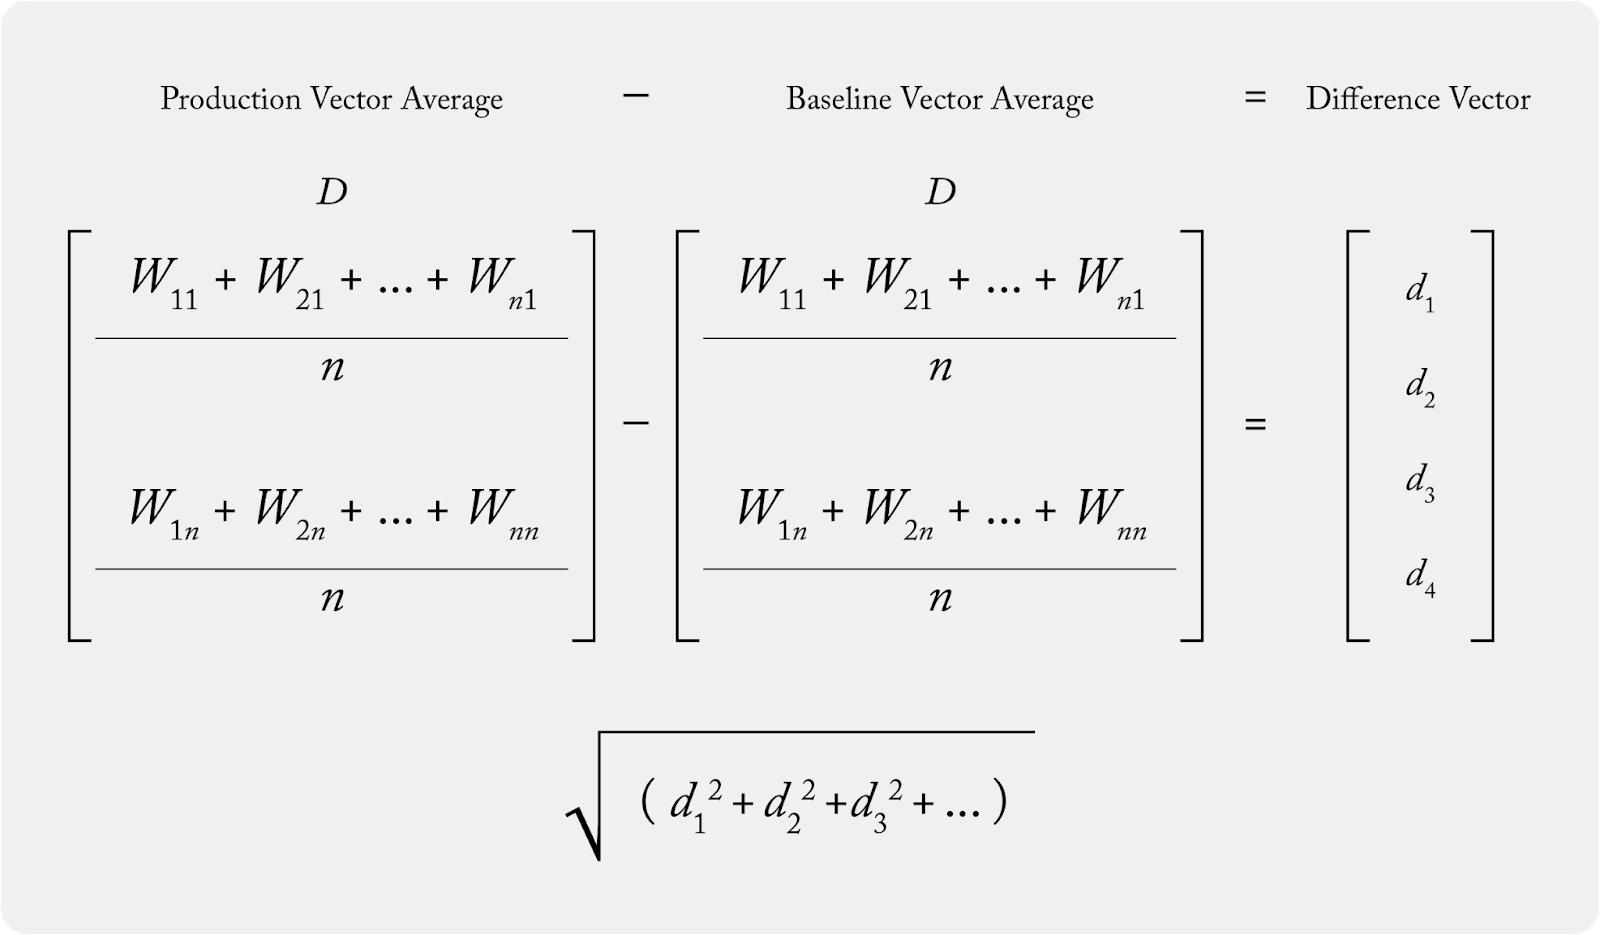
Once the averages for the production vector and the baseline vector are calculated, the euclidean distance is taken. To calculate, take the difference between the two vectors and then take the square root of the sum of the differences.
Cosine Distance Formula
Cosine distance is essentially 1 – cosine similarity. The more similar two vectors are, the smaller the distance. The less similar they are, the greater the distance.
To calculate cosine distance, we again need our two vectors – in this case, let’s take a production vector and a baseline vector. The calculation for cosine distance: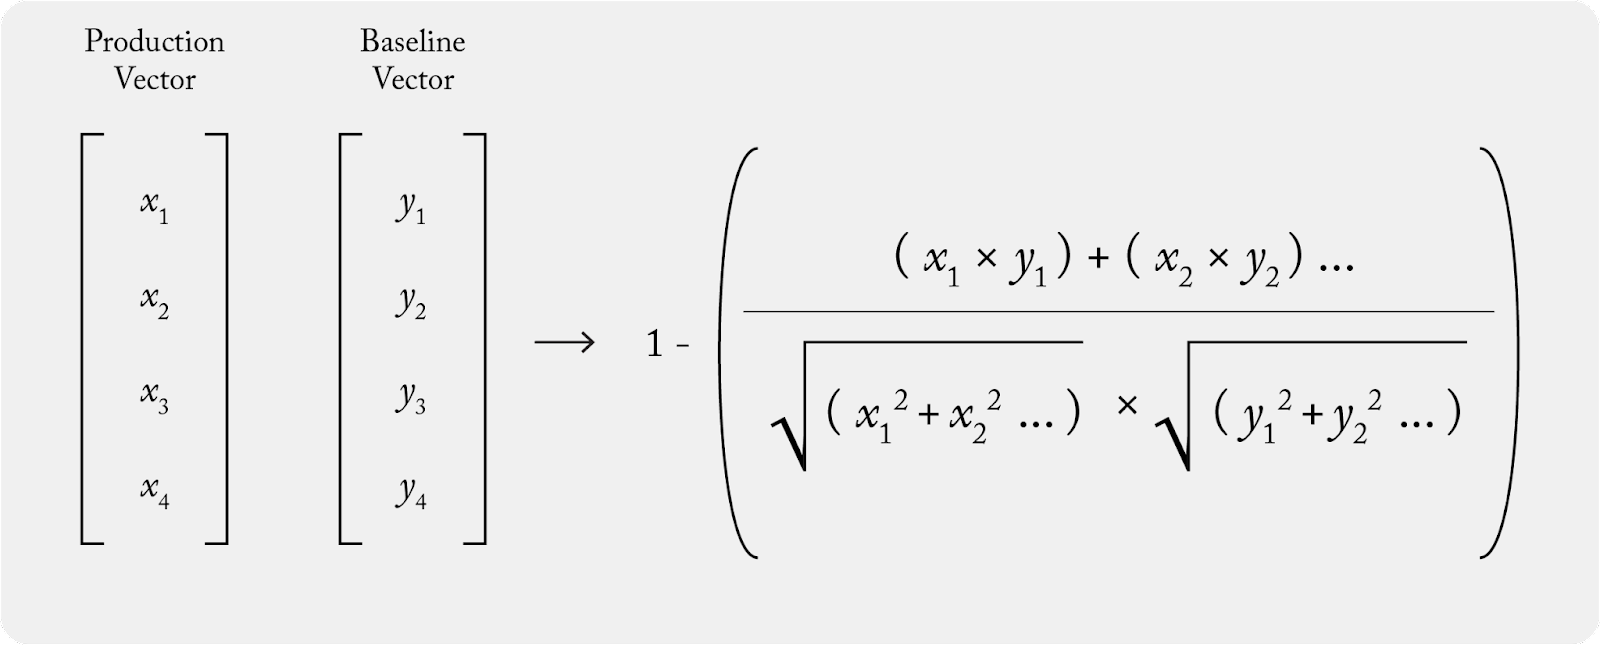
Put another way: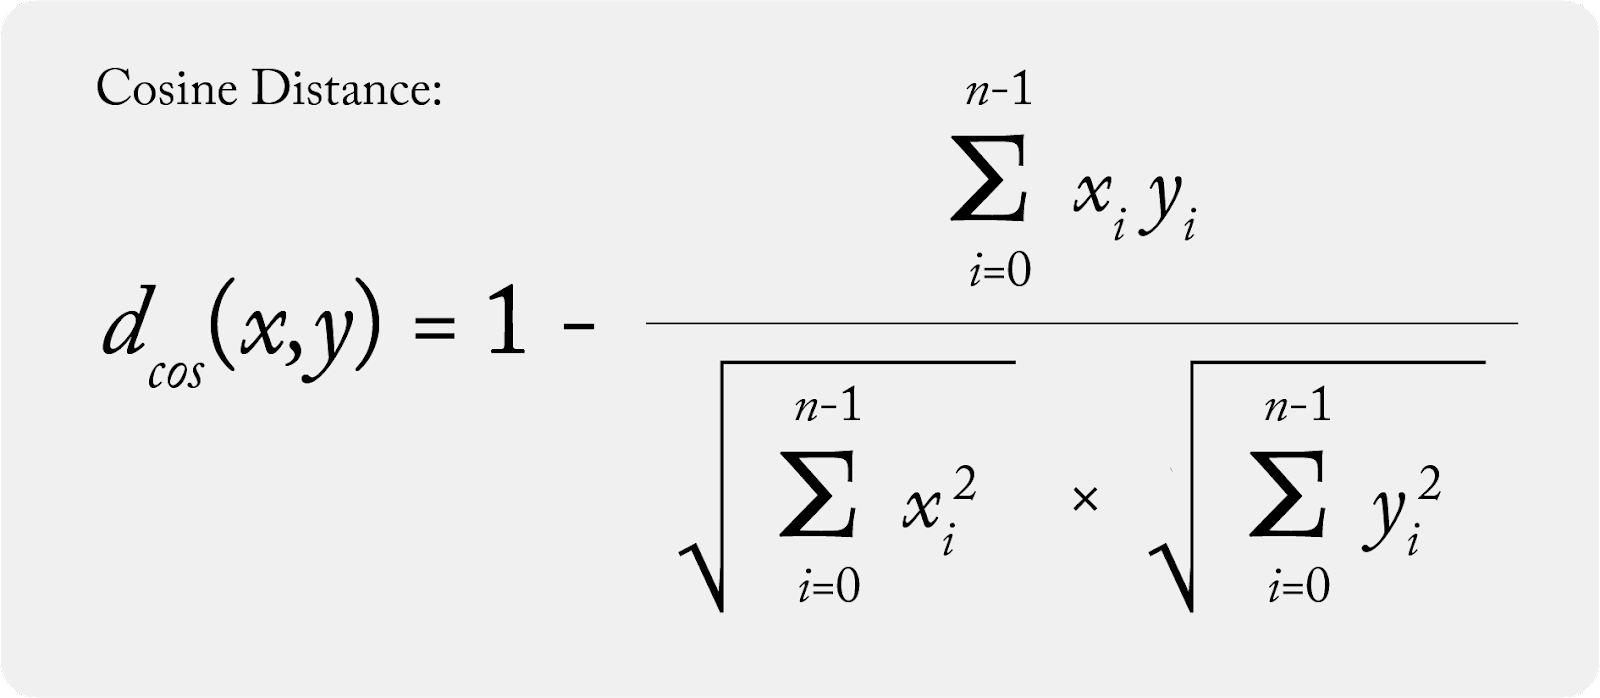
Efficacy of Euclidean Distance
After testing a large number of fairly complex drift measurement approaches, we found that monitoring the simple euclidean distance of embedding sets is stable, sensitive and scalable compared to the other methods.
When comparing euclidean versus cosine distances across datasets, cosine was a lot more sensitive and dramatic when drift was increased. Euclidean still detected the change, but was more stable across experiments.
In the image below, the left-hand Y-axis is the euclidean delta, and the right-hand Y-axis is the cosine delta. They are directionally similar.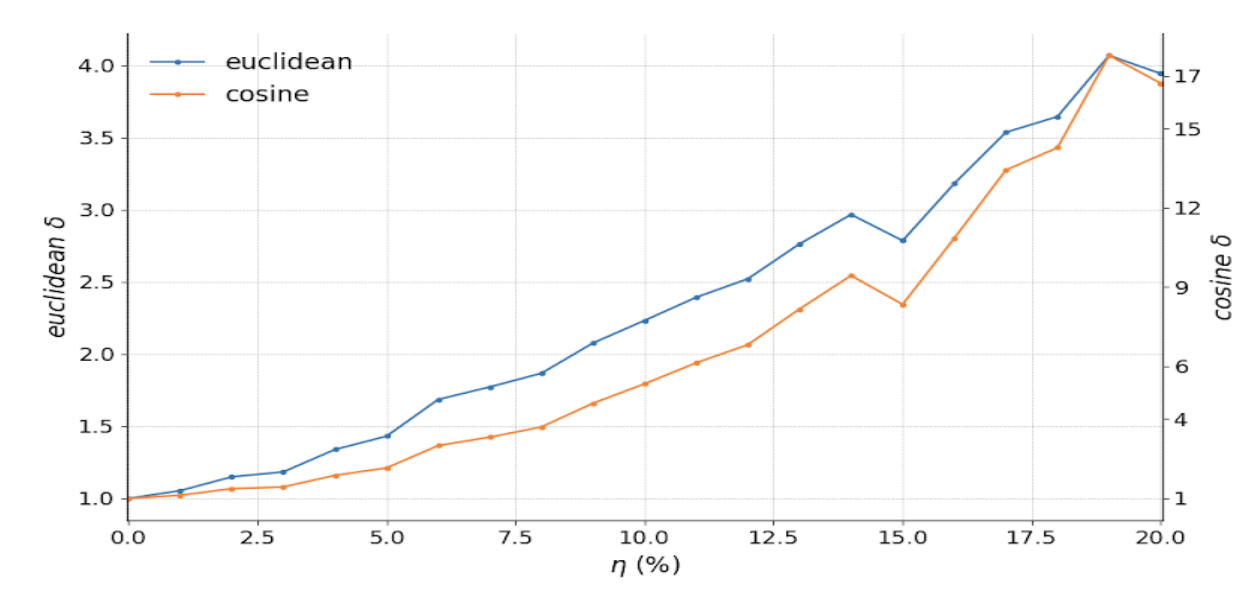
Below, we’ll walk through some experiments where drift was introduced and euclidean distance accurately picked up the data drift.
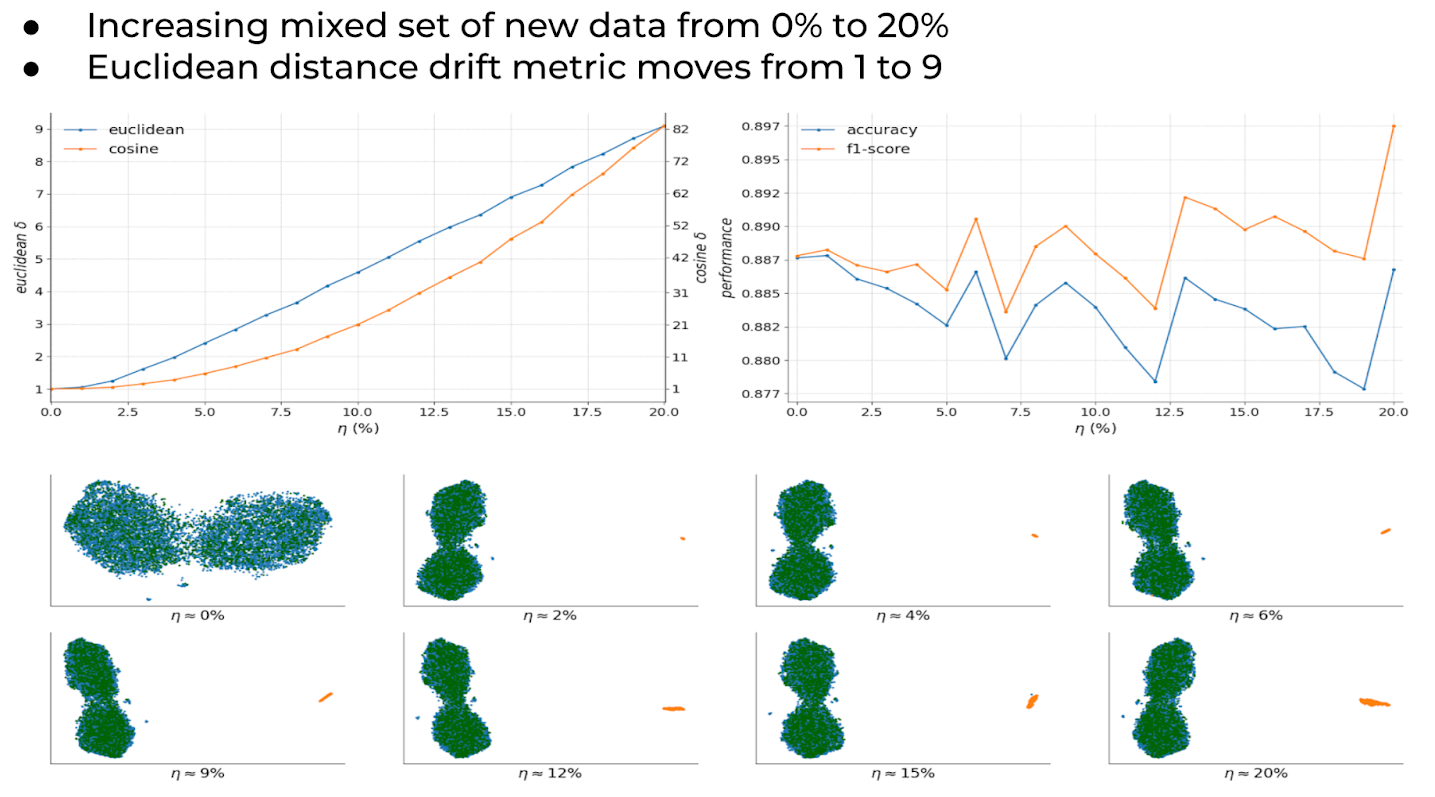
Experiment Results #1 – Introducing New Value Not In Training Into Production
The diagram above shows an example of drifted data mixed in from production that was not in the training dataset. Even though a lot of the vectors overlap and reside close to each other in the manifold, the euclidean distance metric in the top left corner detects the differences.
Experiment Results #2 – Introducing Completely Different Data Into Production Data
This dataset example here has a vector space that looks quite different for the drifted data, showing a yellow group in the bottom images off to the right. As more drifted data is mixed into the production dataset, the euclidean distance increases and detects the data difference (top left).
Additional Techniques
In order to add a more robust alerting statistic on top of euclidean distance, a KS 2 sample test can be used on the embedding metric. Multiple samples from the embedding set can be taken calculating the euclidean distance metric for each sample set separately, and the KS test can be used to determine if drift has or hasn’t occurred.
Conclusion
As CV and NLP models proliferate, more ML teams are looking to embedding drift to help detect and understand differences in their unstructured data. After testing an extensive set of different scenarios across a large variation of data, we’ve found that leveraging euclidean distance can be a sensitive, stable, and scalable measurement to help in that task.