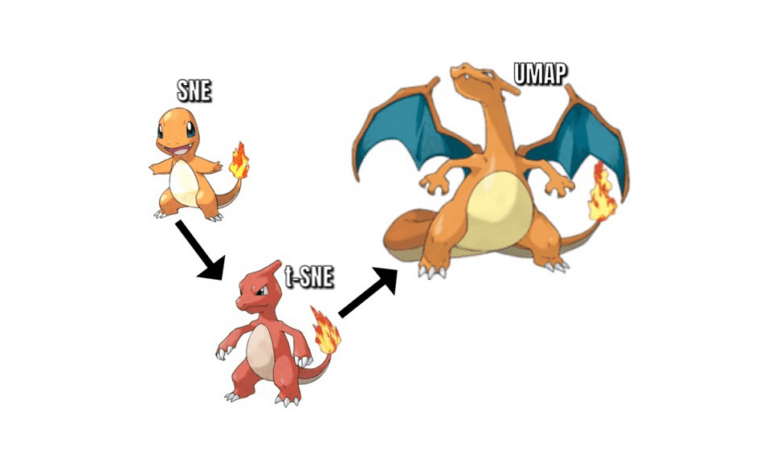
t-SNE (t-distributed Stochastic Neighbor Embedding) is a dimension reduction technique for data visualization. t-SNE was built to solve several issues with SNE, namely that its cost function is very difficult to optimize and that it has a crowding problem. Two main modifications are introduced by t-SNE to solve these issues: symmetrization and the use of t-distributions for the low-dimensional probabilities, respectively. These modifications arguably made t-SNE the state-of-the-art for dimension reduction for visualization for many years until UMAP came along.
Build better agents with Arize
Trace, evaluate, and learn. Build agents that work with Arize AX and start tracing your runs today.
Prefer open source? Try Arize Phoenix for self-hosted, open source agent observability.

Key takeaways
- t-SNE maps high-dimensional points to 2D or 3D for visual exploration of clusters and outliers.
- It preserves local neighborhoods better than global distances; between-cluster spacing is not meaningful.
- Perplexity and learning rate strongly affect layout; fix hyperparameters when comparing weeks.
- Use t-SNE on samples, not full billion-row corpora; run offline in monitoring workflows.
- Do not treat t-SNE coordinates as features for training; they are for human inspection only.
How t-SNE works (conceptual)
Convert high-dimensional pairwise similarities into probabilities that points are neighbors.
Define similar probabilities in 2D using a heavy-tailed t-distribution to reduce crowding.
Minimize divergence between high-D and low-D similarity distributions via gradient descent.
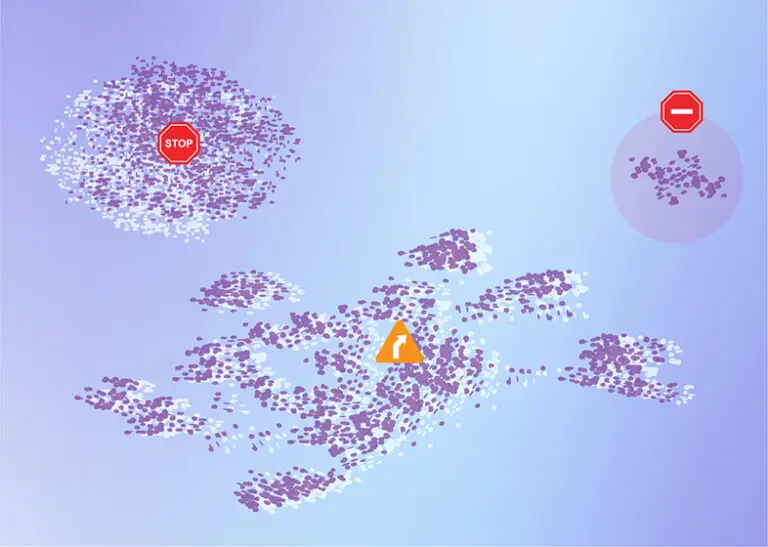
Resulting plots reveal cliques (topics, product families, failure modes) when color-coded by metadata.
Hyperparameters
Perplexity relates to effective number of neighbors (typical range 5 to 50). Too low fragments; too high merges distinct groups.
Learning rate affects convergence stability.
Iterations need enough steps for layout to settle; rerun with fixed seed for reproducibility.
Always record perplexity, seed, sample size, and input embedding model version in monitoring notebooks.
t-SNE versus UMAP
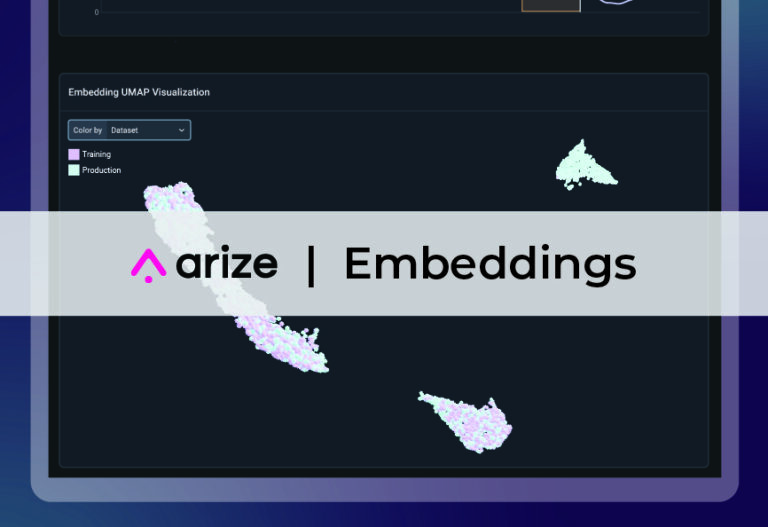
Both target visualization. UMAP often preserves more global structure and runs faster on larger samples; t-SNE remains popular for detailed local cluster inspection.
Neither replaces PCA for linear preprocessing or clustering in original space without careful validation.
Compare both on the same sample when investigating embedding drift in monitoring reviews.
Uses in ML observability
Sample production embeddings weekly; color by error type, language, or model version.
Detect new clusters appearing after catalog launches or policy changes.
Investigate toxic or off-topic content islands in moderation embeddings.
Pair plots with quantitative drift metrics; visuals guide hypotheses, not automatic alerts alone.
Guides on AI model lifecycle management situate visualization in drift triage playbooks.
Classification monitoring habits from shipping image classification models with confidence extend to embedding sample reviews for NLP and retrieval.
Store plot parameters and sample IDs in eval workflows described in LLM and agent evaluation platforms.
Pitfalls
Reading absolute distance between clusters as meaningful ranking.
Changing hyperparameters each run and chasing phantom drift.
Plotting different sample sizes without noting density effects.
Using t-SNE output coordinates as model inputs, which distorts geometry.
Monitoring workflow
Archive t-SNE plots with identical seeds beside PSI tables in incident tickets so reviewers see quantitative and visual evidence together.
Sample stratification
Stratify samples by error type and volume so plots are not dominated by easy majority classes.
Practitioner checklist
Before changing production settings, confirm labels, thresholds, and monitor windows match the definitions used in your last offline eval. Snapshot dashboards when incidents start so postmortems compare apples to apples.
Run slice-level reviews on high-traffic cohorts weekly even when global metrics look flat. Many failures appear first in one locale, product line, or prompt route.
Document model version, featurizer hash, and data window in every incident ticket. Future you needs that context to interpret drift charts.
When metrics disagree (offline vs online, precision vs recall), write down the business cost of each error type before picking a fix. Metrics are proxies; costs are the decision.
Share eval harness links in release notes so support and PM teams know which golden tasks must pass before they announce improvements.
FAQ
Can I cluster on t-SNE coordinates?
Possible for exploration but validate clusters in original embedding space with proper metrics.
How many points should I plot?
Thousands often suffice; beyond that subsample stratified by metadata for readable plots.
Should t-SNE run on raw features or embeddings?
Often embeddings for text/image; tabular may use scaled features or PCA preprocessing first.
Is t-SNE deterministic?
With fixed seed and same input, layouts repeat; different seeds yield rotated variants with similar local structure.
When should I prefer UMAP instead?
Larger samples, need for faster runs, or when preserving broader global layout matters alongside local clusters.