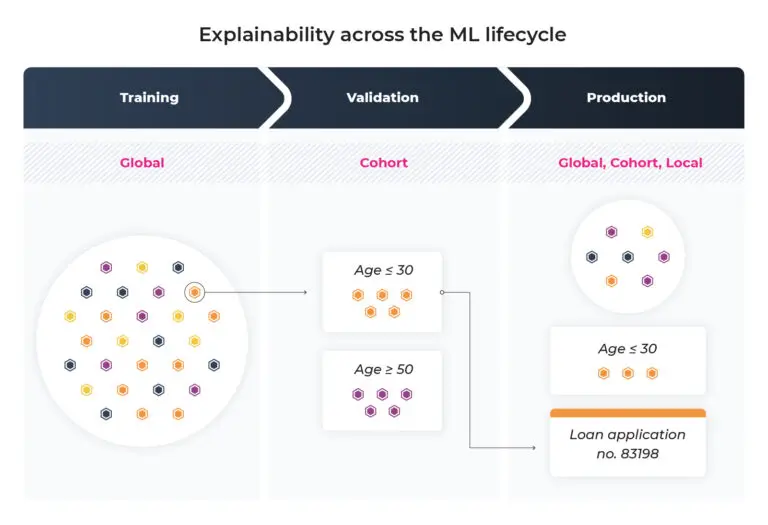
On each feature of an ML model, a Shapley value can be computed to explain how that feature contributed to the difference between the model’s prediction for an example and the baseline (average or expected) model prediction. Short for Shapley Additive exPlanations, SHAP values are the numeric outputs of an explainability method rooted in cooperative game theory. The SHAP values of all input features sum to the gap between the observed prediction for that example and the baseline output, which is why the method is additive.
If you debug production models, SHAP values give you a per-feature ledger for a single prediction: which inputs pushed the score up, which pulled it down, and by how much relative to a defined baseline. They are most actionable when you treat them as local explanations tied to one row, not as a guaranteed global ranking.
Build better agents with Arize
Trace, evaluate, and learn. Build agents that work with Arize AX and start tracing your runs today.
Prefer open source? Try Arize Phoenix for self-hosted, open source agent observability.

Key takeaways
- Each SHAP value measures one feature’s contribution to moving the prediction away from a baseline for a specific instance.
- Feature SHAP values sum to (prediction − baseline) under the SHAP axioms for the chosen explainer.
- Local SHAP explains one prediction; aggregating absolute SHAP across rows approximates global importance with caveats.
- Computation cost varies widely by explainer; Kernel SHAP is flexible but slow on large feature sets.
- SHAP complements drift monitoring: attributions explain a score; distribution metrics show whether inputs moved.
Additivity and the baseline
SHAP assigns one number per feature for a given prediction. Sum those numbers and you recover the difference between the model output on that row and the baseline output the explainer uses. The baseline might be the average prediction over a reference dataset, the expected value with missing features, or another background distribution you define.
Changing the baseline changes the values. Document which background set you used when you share plots with stakeholders. Two teams can disagree on SHAP charts for the same model if their baselines differ, even when the model weights are identical.
Positive SHAP for a feature means that feature pushed the prediction higher than the baseline would suggest, holding the SHAP accounting definition fixed. Negative SHAP means it pushed lower. Magnitude indicates strength of contribution under the method’s assumptions, not causal effect in the real world.
Local vs global explanations
Local SHAP answers: why this prediction for this customer, this image, this transaction? Inspect top positive and negative contributors before overriding a model decision or filing a bug.
Global importance often averages absolute SHAP values across many rows or plots distribution of SHAP per feature. That summary is useful for feature screening but can hide interaction effects. Two features with low average SHAP may interact strongly on a critical slice.
Some workflows condition SHAP on cohorts: compute values for denied applications only, or for rows where the model disagreed with auditors. Slice-based attribution catches problems global averages miss.
How SHAP values are computed
SHAP connects to Shapley values from game theory: treat features as players in a coalition game where the payout is the model prediction. The Shapley value fairly distributes payout across players given all orderings of feature inclusion.
Exact Shapley for p features requires exponentially many coalitions, so libraries implement approximations:
- TreeSHAP for tree ensembles: fast, exact for tree models.
- DeepSHAP / gradient methods for neural nets: approximate, architecture-dependent.
- Kernel SHAP model-agnostic perturbation: flexible, often slow.
When teams complain SHAP is too slow, they often ran Kernel SHAP on wide data with many perturbation samples. Pick the explainer that matches your model class before blaming SHAP broadly.
SHAP in production workflows
SHAP values help during development and incident review more often than as a real-time API on every request. Typical uses:
- Error analysis on false positives and false negatives.
- Regulatory or customer explanations for individual decisions where linear additive stories are acceptable.
- Feature sanity checks after retraining (did the model lean on a leaky column?).
Pair attribution review with model, concept, and data drift monitoring. Drift tells you input distributions moved; SHAP tells you how those inputs moved scores on examples you inspect. Neither replaces labeled eval on outcome metrics.
Store SHAP outputs with model version, explainer type, baseline sample hash, and instance identifiers. Reproducing a chart months later requires the same background draw and random seed for approximate methods.
Limits and misreadings
SHAP values are not causal estimates. They explain a model’s function, which may encode spurious correlations. A feature with high SHAP on a loan denial does not by itself prove that feature should drive policy.
Correlated features split credit arbitrarily under Shapley definitions. Two redundant columns may each show moderate SHAP when either alone would suffice. Use domain knowledge and ablation tests alongside SHAP.
High-dimensional inputs (text embeddings, wide one-hot sets) produce many small SHAP entries that are hard to narrate. Summarize by group (all geography columns, all payment history fields) when presenting to humans.
For deployment governance, fold SHAP review into AI model lifecycle management: check attributions on a validation slice before promote, and again when drift alerts fire.
SHAP values vs related explainability tools
LIME fits a local linear model around a prediction; SHAP values come from a specific Shapley-based allocation with different axioms. Integrated Gradients attribute neural net predictions along input gradients. Choose based on model type, speed budget, and whether additive feature stories match your compliance needs.
When shipping classification models with confidence thresholds, SHAP helps explain borderline scores near the cutoff, where small feature shifts flip decisions.
FAQ
Do SHAP values always sum to the model output?
They sum to the difference between the prediction and the baseline defined by the explainer, not necessarily to the raw logits unless that is how the explainer parameterizes output. Check your library’s output type (probability vs log-odds) before interpreting additivity.
What baseline should I use for SHAP?
Common choices are the mean prediction over a training sample, a random background draw, or a domain-specific reference cohort. The baseline should represent “uninformative” or “typical” inputs for your use case. Always record which you used.
Can I use SHAP values in real time on every prediction?
Usually not at full feature width with Kernel SHAP. TreeSHAP on tree models is faster but still adds latency. Many teams compute SHAP offline on samples or on demand for disputed cases.
Why do correlated features share SHAP credit?
Shapley allocation divides marginal contributions across orderings. When features carry redundant information, each can receive partial credit. Consider grouping correlated features or using model-specific importance for redundancy checks.
How are SHAP values different from feature importance in tree models?
Tree gain importance is global to the structure of the ensemble. SHAP provides per-row signed contributions consistent with an additive explanation framework. They often rank similarly but answer different questions.