

Chapter summary
Last updated August 12, 2026.
Arize publishes this comparison and includes its own products. We reviewed current first-party documentation and evaluated each platform against the same production-incident workflow. Features, packaging, deployment options, and product status change quickly, so verify a shortlist against current documentation and your own traces.
The best AI agent debugging tool depends on what happens after a production failure appears. A trace viewer can reconstruct one run. A production debugging system has to help a team find related failures across live traffic, isolate the likely cause, reproduce the behavior, test a change, and watch for recurrence.
But a lot has changed in the last year. For instance, automated failure analysis used to be something that made great tools stand out. But now, tools like Signal from Arize AX automatically scan production traffic on a schedule, group repeated failures into tracked issues, propose a root cause, and open a pull request.
In this guide, we’ll break down exactly what to consider about how best to debug agents. We’ll explain each of the top nine best AI agent debugging tools and work to be as objective as possible while laying out where you should poke, prod, and ask questions.
A short TLDR:
- LangSmith Engine provides the most complete prebuilt recurring-issue-to-pull-request workflow, especially for LangChain and LangGraph teams. Engine follows an opinionated loop from recurring issue detection through diagnosis, evaluator and dataset creation, pull request, and recurrence detection. Its code-change path works with any connected repository.
- Arize AX is the best fit for teams that want recurring production failure discovery plus customizable agent automation around it. Signal continuously discovers recurring failures and turns them into persistent, evidence-backed investigations. Swarm lets teams extend that foundation with managed agents tailored to their own investigation, monitoring, remediation, and validation workflows, including workflows that run on a schedule or in response to operational triggers.
- Comet Opik is the best Apache 2.0 option for a persistent issue queue plus local code repair. Diagnostics finds recurring issues, while Ollie can propose an approved change to a developer’s local working copy through opik connect.
- Arize Phoenix is the best open-source AI agent debugging tool. Phoenix provides OpenTelemetry-native tracing, evaluations, datasets, experiments, prompt workflows, and an on-demand AI engineering agent while letting teams run the platform locally or on their own infrastructure.
Braintrust, Datadog, Galileo, Langfuse, and W&B Weave are stronger choices for particular stacks and operating models. The deciding question should be what the product discovers without prompting, what artifact it creates, what evidence supports the diagnosis, where a proposed change lands, and how the incident becomes durable evaluation coverage.
Scope: This page is about diagnosing and remediating production incidents with LLMs and agents.
- For evaluation methods, see AI agent evaluation.
- For broad evaluation-platform selection, see the LLM and agent evaluation platforms comparison.
- For category architecture, see what an agent observability platform does.
- For implementation details, use the Signal production debugging tutorial.
What is an “agent debugging tool” anyways?
An AI agent debugging tool captures and analyzes the observable execution of an agent across model calls, retrieval, tool calls, state changes, handoffs, outputs, and verified outcomes. It helps an engineer explain why a run failed, find related failures across production traffic, test a proposed change, and monitor whether the problem returns.
Debugging and evaluation are related but different disciplines. Evaluation determines whether behavior met a defined standard. Debugging uses traces, external state, version metadata, and often application code to explain why the standard was missed and identify a change worth testing.
A low score is a signal, and not necessarily a diagnosis.
Comparing the best tools on the market today
| Tool | Best for | Cross-run discovery and artifact | Change path and deployment |
|---|---|---|---|
| Arize AX | Managed production incident triage | Signal reviews production traces on a recurring schedule and creates persistent, ranked issues with supporting evidence and a likely cause | Enterprise Managed Agents can open a reviewable pull request. Managed deployment; Enterprise self-hosting available |
| Arize Phoenix | Open-source, self-hosted trajectory debugging | No managed scheduled scanner; provides traces, annotations, evaluations, datasets, experiments, and on-demand investigation | No first-party persistent-issue-to-PR loop. Open source under ELv2; Phoenix Cloud, local, or self-hosted with no self-hosted feature gates |
| LangSmith | Automated recurring-issue-to-PR workflow | Engine scans every six hours by default, creates persistent issues, and can automatically reopen a recurring issue | Opens a pull request in any connected repository. Cloud; Enterprise self-hosting. Engine is Beta |
| Comet Opik | Persistent incident queue plus local repair | Diagnostics scans the previous 24 hours daily and on demand, producing deduplicated issues with severity and occurrence history | Ollie proposes approved edits through a local opik connect session. Open-source Apache 2.0 core; cloud or self-hosted |
| Braintrust | Evaluation-first product teams | Topics classifies and clusters production traces daily; Loop investigates traces and creates scorers or datasets | No documented first-party application-code workflow. SaaS and enterprise deployment options; Topics is Beta |
| Langfuse | MIT-licensed self-hosted tracing and evaluation | No documented autonomous production scanner; discovery is driven by scores, filters, dashboards, reviewers, and the on-demand Cloud Assistant | No first-party application-code workflow. Open-source MIT product features; cloud or self-hosted; Assistant is Cloud-only Public Beta |
| Galileo | Failure discovery connected to evaluation and runtime policy | Signals surfaces recurring production patterns and retains context across analyses; findings can become evaluators | MCP hands findings to an IDE or coding agent. Agent Control can enforce runtime policies. SaaS and enterprise deployment options |
| Datadog Agent Observability | AI behavior correlated with infrastructure telemetry | Patterns clusters selected production traffic; Automation Rules continuously route matching spans into datasets or annotation queues | No documented persistent issue-to-PR workflow in Agent Observability. SaaS |
| W&B Weave | Existing Weights & Biases users | Built-in and custom signals classify production behavior; sessions, turns, tools, and subagents remain traceable | W&B Skills and MCP give coding agents access to traces and evaluations; no documented first-party persistent issue-to-PR loop. Cloud, dedicated, or self-managed options |
Build better agents with Arize
Trace, evaluate, and learn. Build agents that work with Arize AX and start tracing your runs today.
Prefer open source? Try Arize Phoenix for self-hosted, open source agent observability.

What debugging agents in production requires
When you’re debugging production agents, you typically need to execute a sequence of engineering tasks. That means a straightforward dashboard view isn’t enough.
A useful platform should help a team complete six steps:
1. Reconstruct the run
Capture the user request, model calls, retrieval results, tool names and arguments, tool responses, state transitions, handoffs, retries, errors, and final outcome in one connected trace or session. Include prompt, model, agent, tool, and release versions so the team can determine what changed.
A trace that omits tool results or flattens every action into one model span may show that a run was bad without preserving enough evidence to explain why.
2. Discover the pattern
Determine whether the incident is isolated or part of a recurring failure mode. The relevant cohort may be defined by task, user segment, tool, release, agent version, model, geography, or another piece of metadata.
This is where production platforms diverge most. Nearly every product can display a trace tree. Far fewer products identify related failures.
3. Localize the likely cause
Narrow the failure to the model, prompt, retrieval layer, tool contract, orchestration logic, state handling, infrastructure, policy, or evaluation specification. A useful diagnosis cites the traces or spans that support the claim and states what remains uncertain.
Generated diagnoses should be treated as hypotheses with evidence, not verified causes. A malformed tool argument may come from the model, a stale schema, a serialization bug, or an orchestration layer that transformed the request after generation.
4. Preserve a reproducible case
Turn representative incidents into versioned dataset examples with expected outcomes, allowed behavior, and relevant external state. A production trace is evidence. But it’s not a complete test until the team defines what should have happened and how that expectation will be checked.
5. Validate a proposed change
Compare the current and proposed application versions against the incident and a broader regression set. Evaluate the full agent behavior when a change can affect routing, tools, state, latency, cost, or external outcomes. A prompt replay alone cannot validate a harness-level fix.
6. Detect recurrence
Apply the same evaluator, rule, signal, or issue definition to new production traffic. Route later failures to the team that can act and distinguish recurrence from a new failure mode.
How we selected and evaluated these tools
A product qualified for the main comparison when it met all of the following criteria:
- It ingests or reconstructs production agent traces or sessions.
- It exposes multi-step execution rather than only model request logs.
- It supports cross-run discovery, production evaluation, or a structured investigation workflow.
- It provides a path from an incident to reusable evaluation coverage.
- It is publicly available to teams rather than only described in a research paper or waitlist.
- Its relevant capabilities are documented in first-party product pages, documentation, or release notes.
We evaluated the platforms on:
- Trace fidelity: Can a reviewer recover the execution structure and evidence needed to explain a failure?
- Unprompted discovery: Does the platform surface failures no engineer explicitly queried?
- Cross-run analysis: Does it group or correlate related traffic?
- Issue lifecycle: Does it preserve severity, evidence, history, resolution, and recurrence?
- Diagnosis quality: Does a proposed cause point to specific traces, spans, constraints, or code?
- Incident-to-regression workflow: Can production evidence become datasets, evaluators, experiments, and CI checks?
- Code-change path: Does the result land as a server-side pull request, local diff, IDE handoff, or evaluation artifact?
- Operational fit: Can the platform meet deployment, privacy, governance, latency, cost, and retention requirements?
- Portability: Can traces, scores, datasets, annotations, and issue evidence move with the team?
We scoped out tools focused only on local step-through debugging, proxy-level model logging, generic infrastructure health, or pre-deployment simulation. Those products can be useful, but they solve a different part of the workflow.
1. Arize AX: best overall for production incident triage
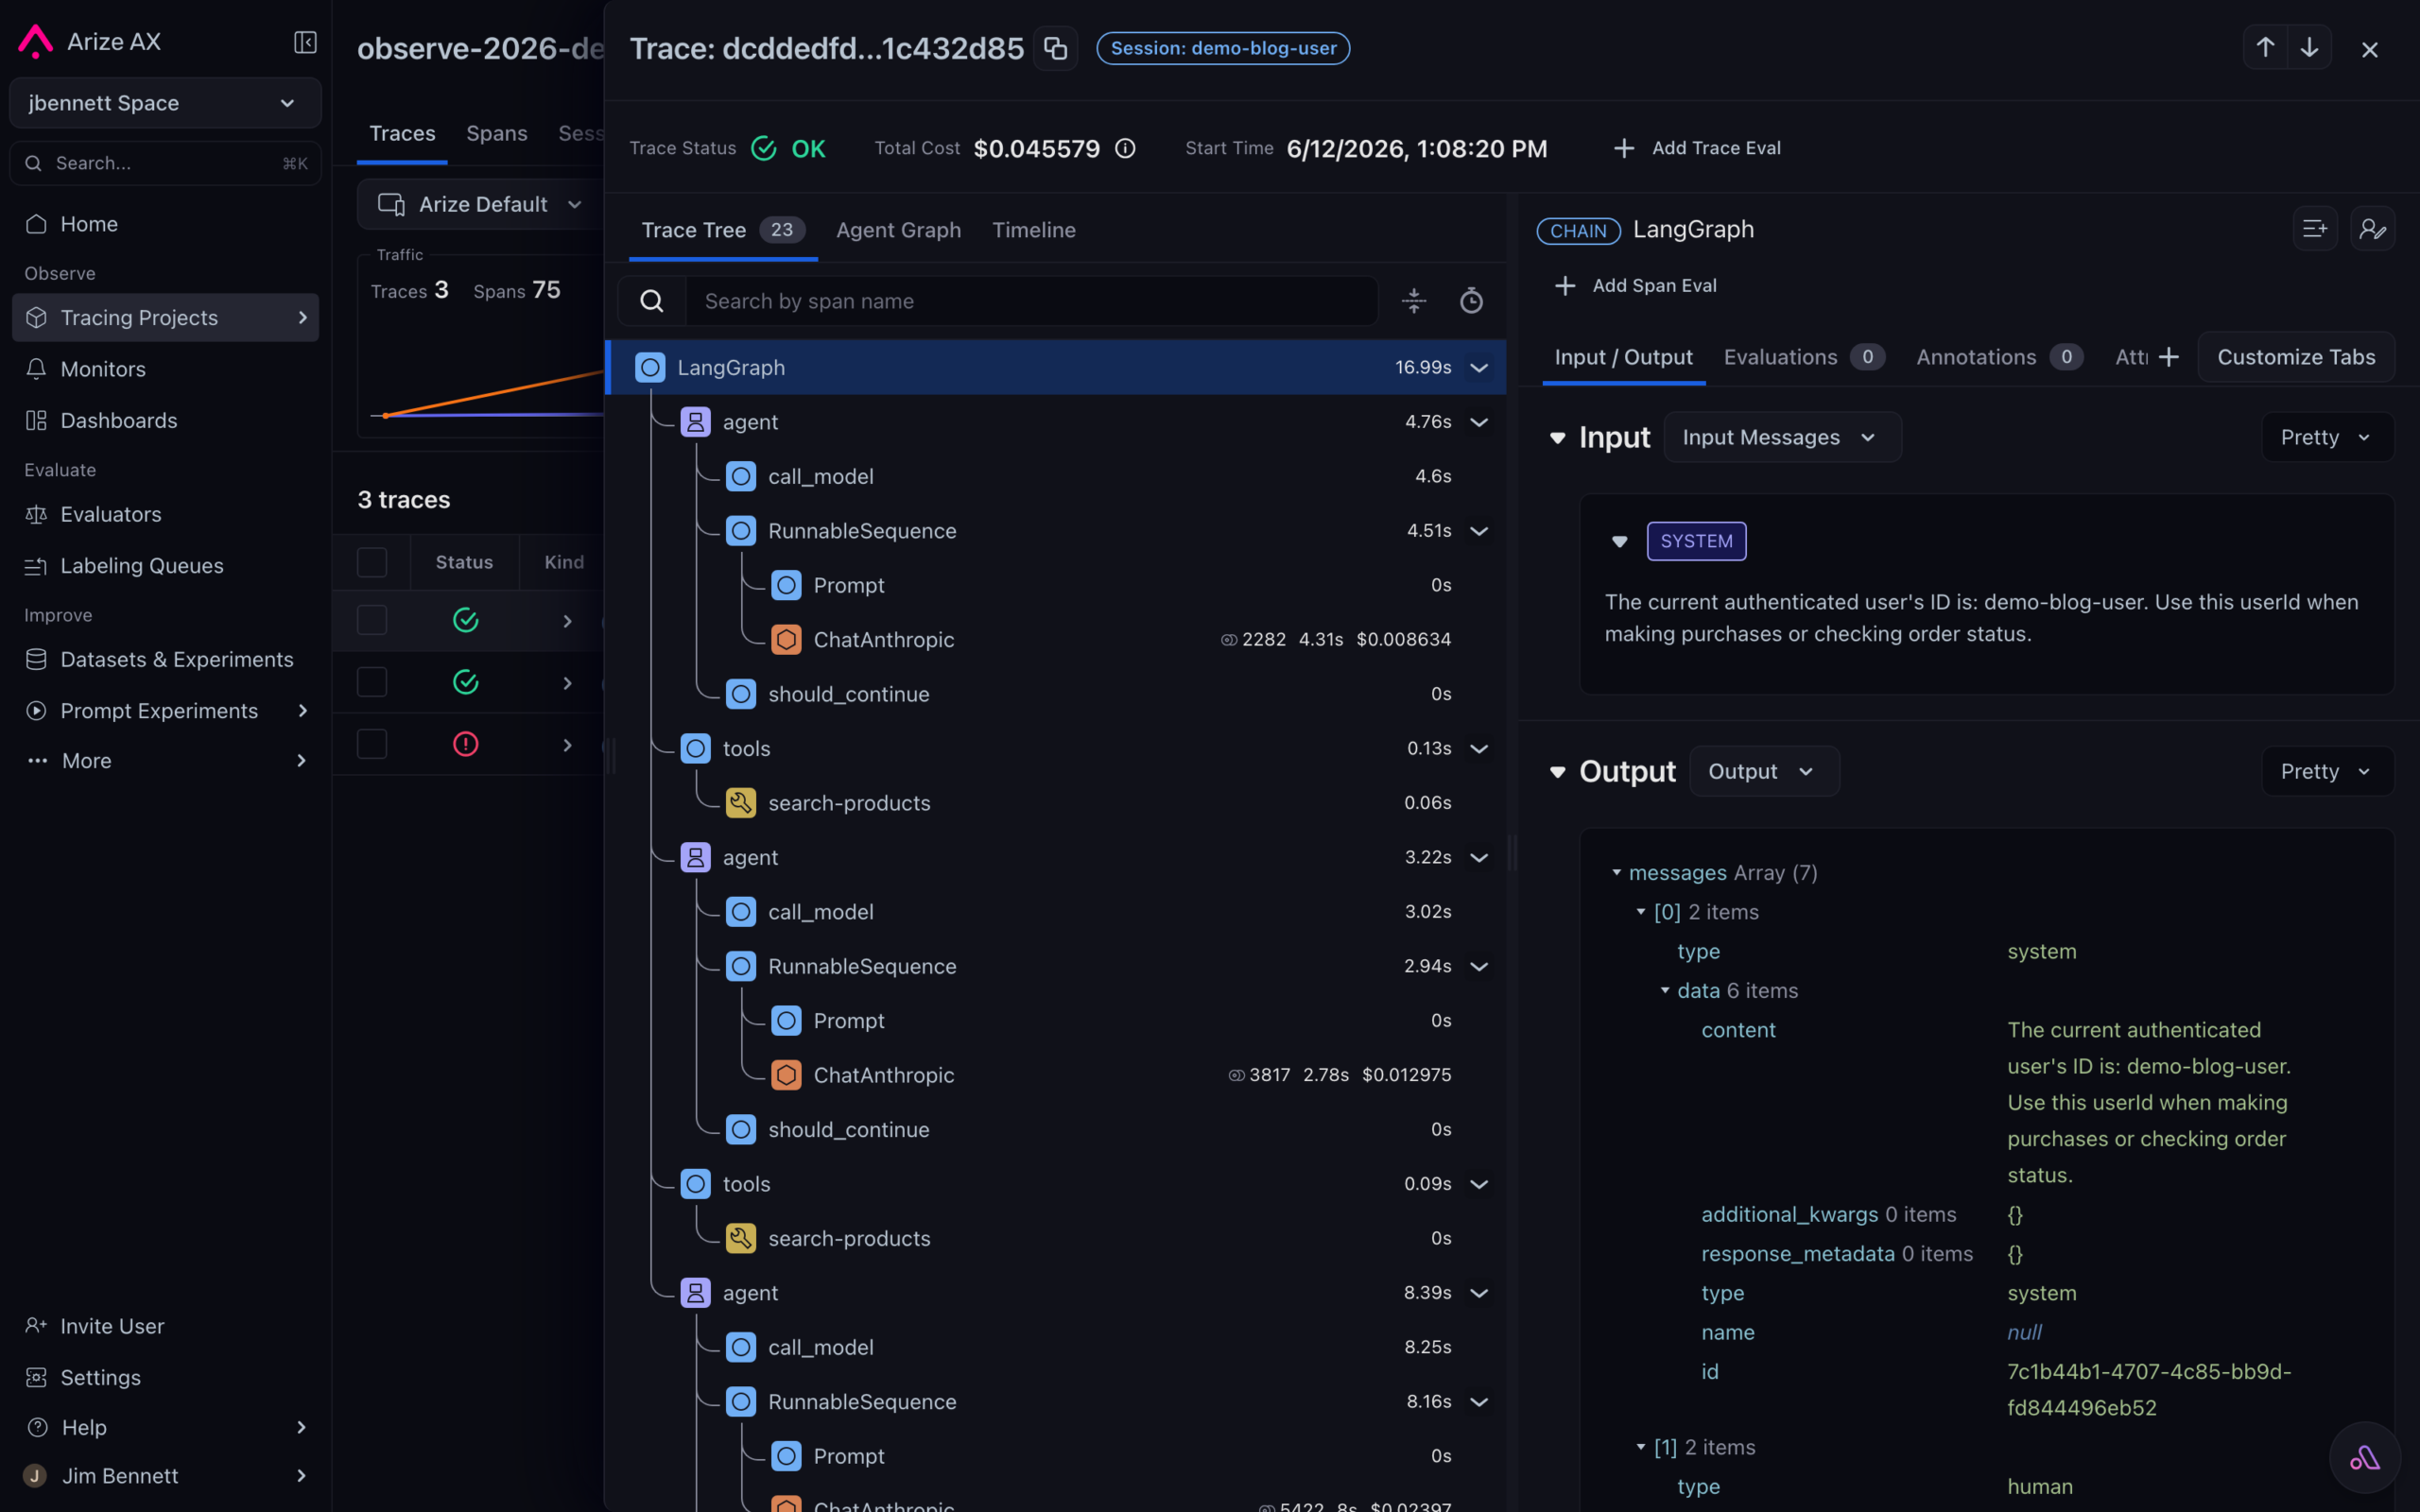
Best for: Teams that want recurring production failures discovered automatically and the flexibility to build managed agent workflows around investigation, remediation, and validation.
Arize AX is strongest once the debugging bottleneck shifts from reconstructing individual runs to finding shared failure modes across production traffic. Signal, a managed agent built into AX, reviews traces on a recurring schedule and groups related failures into ranked issues. Each issue includes supporting traces, an investigation of the recurring behavior, a likely root-cause hypothesis, and a recommended prompt, code, configuration, or evaluation change. Signal carries prior findings forward, giving the team a persistent incident artifact across scans.
That persistence matters because one underlying defect can produce several surface symptoms. A retrieval failure may cause one session to answer from model memory, another to choose an unreliable fallback, and a third to exhaust its retry budget. Signal helps the investigator examine the common trajectory, affected cohort, and supporting evidence before deciding which intervention deserves a test.
Within this workflow, Signal handles recurring detection and issue investigation. Teams can begin with trace-only analysis, review the quality of the clusters, and attach a GitHub repository after the investigations prove useful. In supported Enterprise configurations, repository-aware Managed Agents can inspect the implementation, gather context from connected systems, and open a pull request for human review. Agent Studio supports narrower custom investigations that run once, on a schedule, or when an operational threshold fires. Engineers retain control over approval, merge, deployment, and rollback.
AX connects the investigation to datasets, evaluators, and full-agent experiments. Representative traces can become versioned regression cases, while evaluators define the behavior that a candidate fix must preserve. Teams can run the current and proposed agent against the same dataset and compare outputs, trajectories, evaluator results, retrieval quality, latency, token use, and tool behavior. This workflow can validate changes to routing, tools, retrieval, state, models, prompts, and application code.
OpenTelemetry and OpenInference keep instrumentation portable across frameworks and proprietary harnesses by giving model, retrieval, tool, agent, and custom spans a shared structure. Automated investigation still depends on the evidence captured in those traces, so teams should preserve tool inputs and outputs, routing decisions, state transitions, exceptions, session metadata, external outcomes, and version information before judging Signal’s diagnostic quality.
What to validate
- Does Signal surface meaningful failure modes that the team has not already encoded in an evaluator, query, or dashboard?
- Can teams extend a Signal investigation into a custom Swarm workflow with the context, triggers, and approval boundaries their production process requires?
- Do the supporting traces preserve the trajectory, external state, and version metadata needed to review the root-cause hypothesis?
- How often do engineers accept the proposed cause, intervention, evaluator, and pull request after review?
- Do repository permissions, branch protections, approval gates, and rollback procedures match the team’s change-control requirements?
- Which plan includes Signal issue detection, repository-backed investigation, pull-request creation, and Agent Studio?
Tradeoff: AX provides a managed runtime and orchestration layer for recurring agent-improvement workflows. Swarm lets teams customize the agents and workflows that run within that environment, but teams that want to fully own the runtime, orchestration, and deployment of their long-running feedback loops may prefer to build those workflows themselves around Phoenix, Langfuse, or Opik.
2. Arize Phoenix: best open-source tool
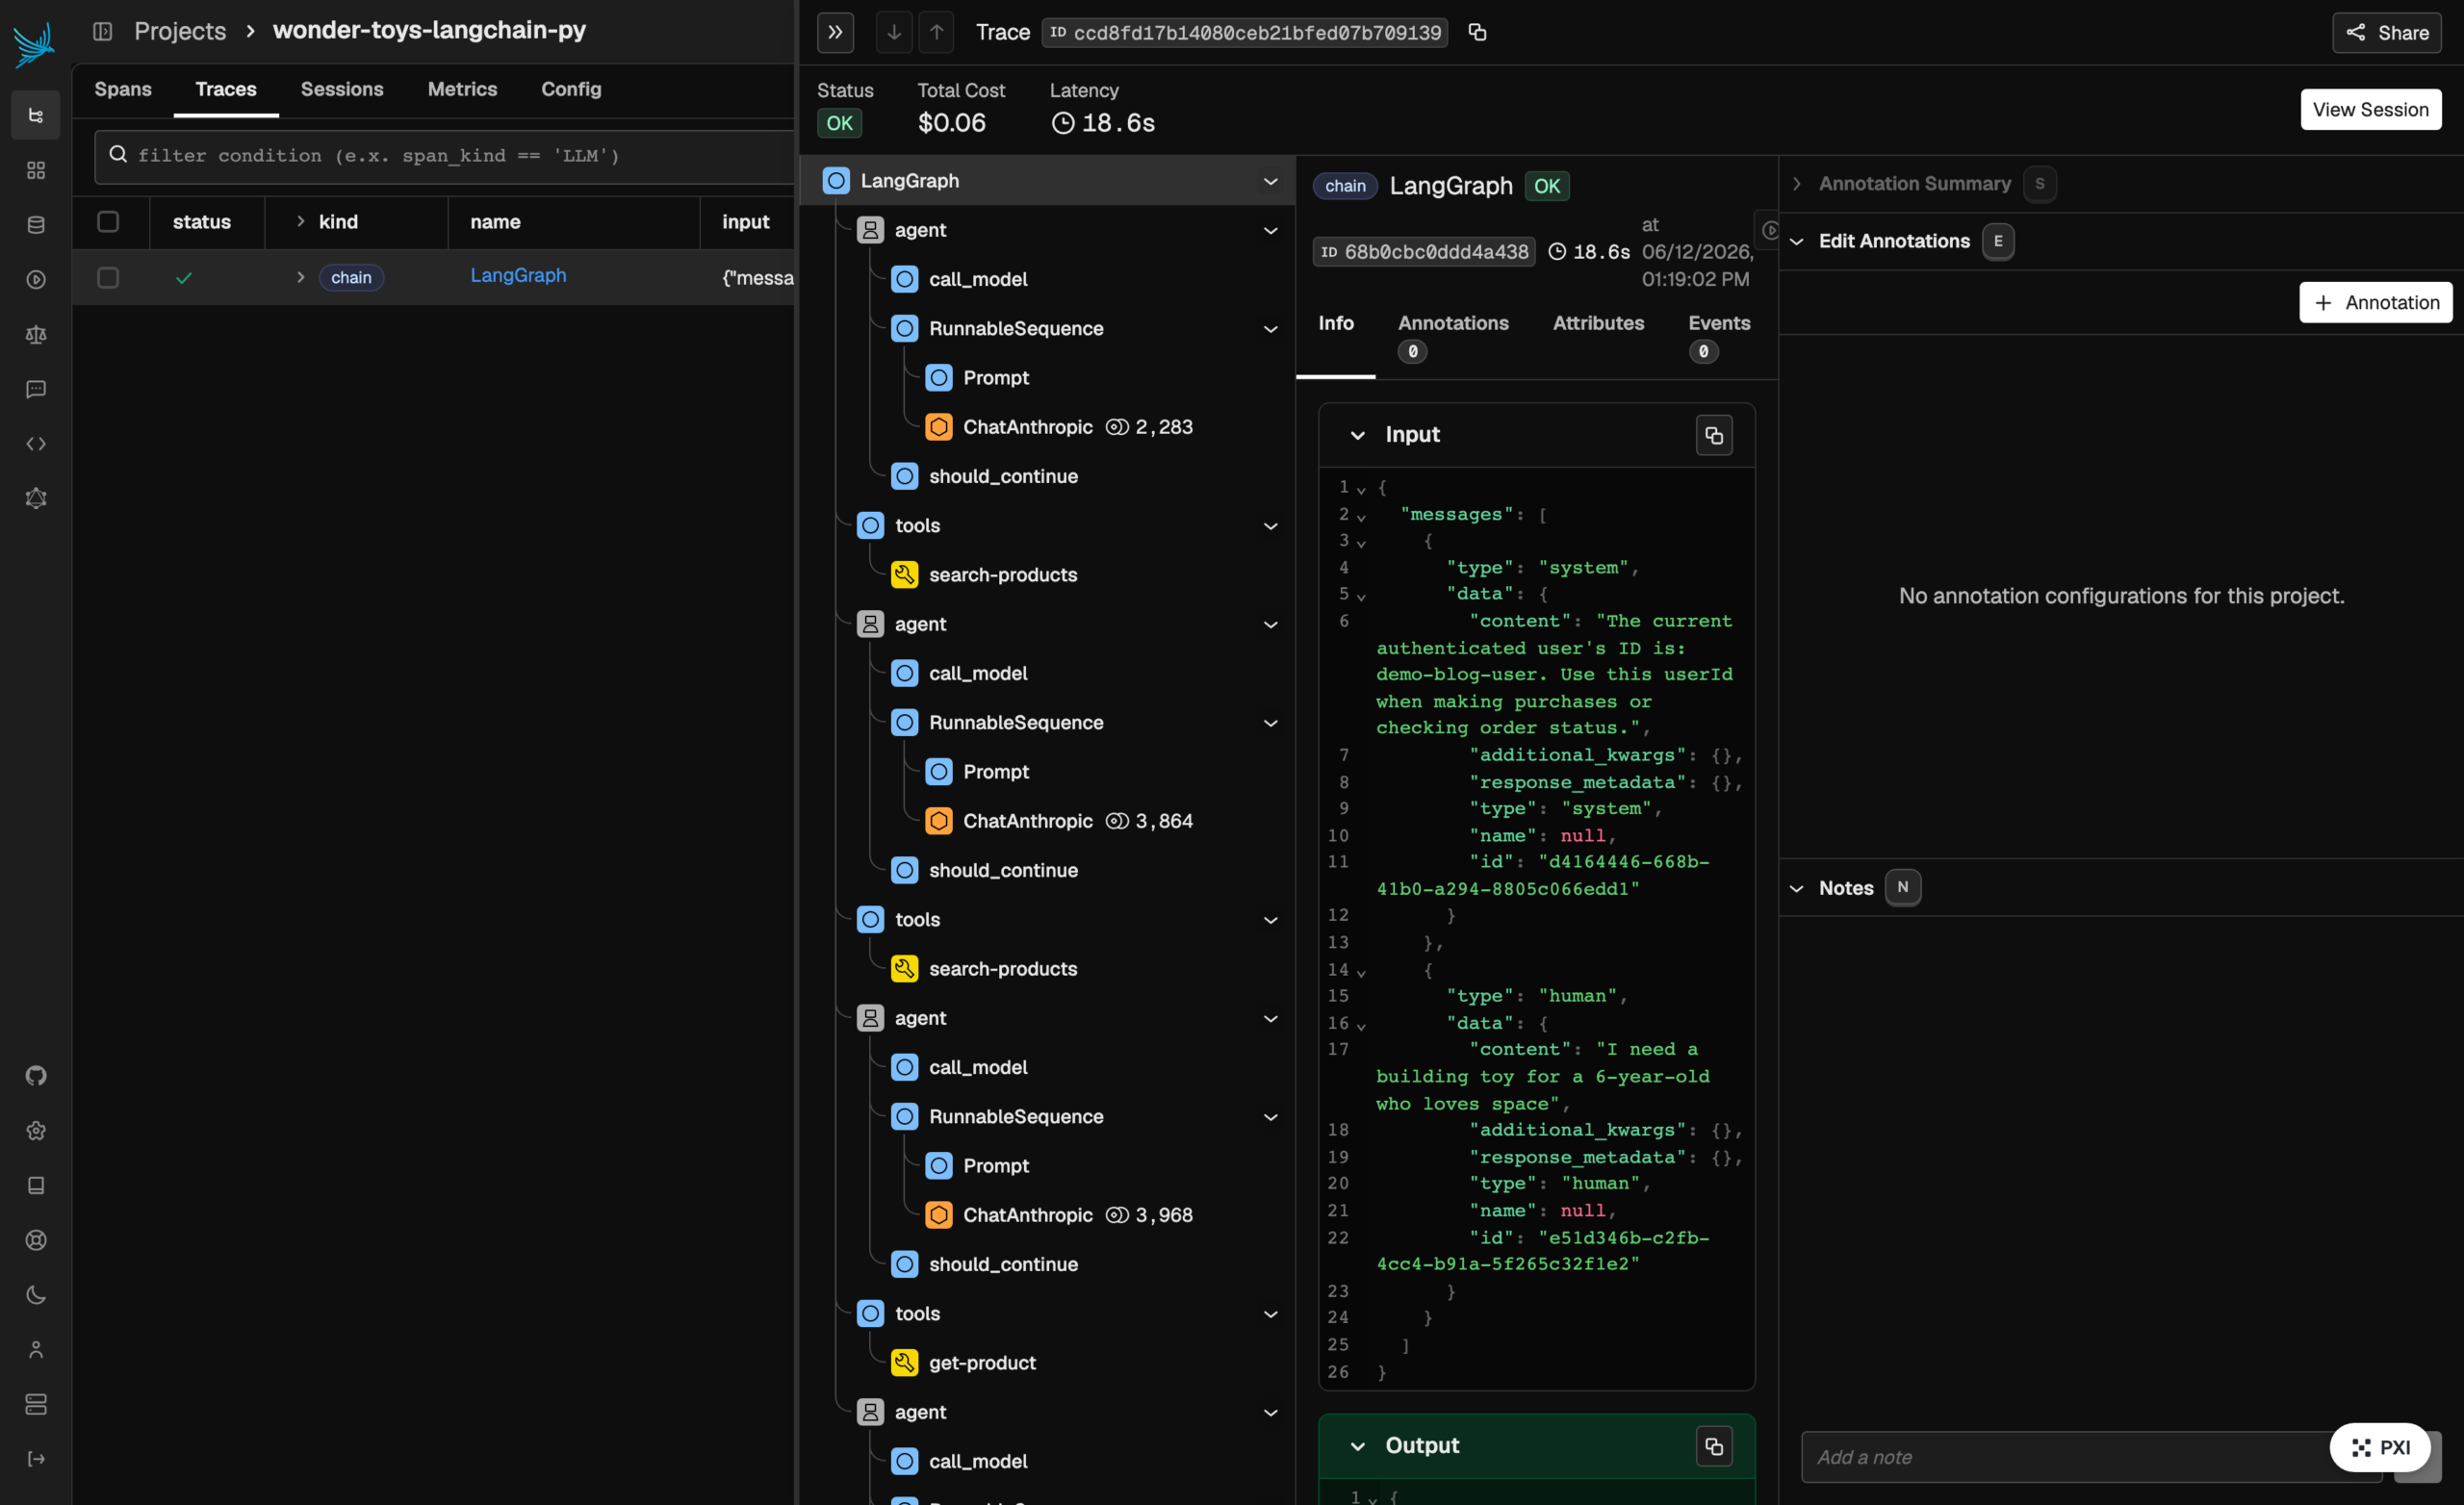
Best for: Teams that want an open-source platform for deep trajectory inspection, evaluations, datasets, experiments, and prompt iteration while controlling where telemetry is stored.
Arize Phoenix is an open-source AI observability and evaluation platform built on OpenTelemetry and OpenInference. It captures model calls, retrieval, tool use, agent transitions, and custom application logic in connected traces. Engineers can inspect a failed trajectory, annotate spans, score behavior, create datasets from production examples, replay model calls, and run experiments that compare application changes on consistent inputs.
Phoenix is the strongest choice in this list when an engineer prioritizes local hosting and already has a suspicious run or cohort and needs to reconstruct what happened with portable, inspectable data. The same trace can support debugging, evaluation, regression-case creation, and an experiment without moving between unrelated tools.
Phoenix also exposes data programmatically. The Phoenix CLI can retrieve failed traces, export cohorts, and feed evidence into coding assistants or local analysis workflows. PXI, or Phoenix Intelligence, is an open-source Beta AI engineering agent inside Phoenix that can investigate telemetry, help write evaluators, and support other directed improvement tasks. PXI is an on-demand investigator rather than a scheduled production incident scanner.
Phoenix does not automatically sweep production traffic and turn recurring failures into persistent issues with severity, ownership, and a resolve-or-reopen lifecycle. Teams that choose Phoenix own the surrounding monitor, query, clustering, alert, and on-call workflow. That is the main operational difference between Phoenix and AX.
What to validate
- Whether traces capture the full harness, tool results, and relevant external state
- Query and storage performance at expected production volume
- The engineering work required for alerting, clustering, and persistent issue management
- PXI’s diagnosis and evaluator-writing quality on representative traces
- Authentication, retention, multi-tenancy, backup, and upgrade ownership
- Whether ELv2 terms fit the intended deployment and redistribution model
Tradeoff: Phoenix maximizes openness, control, and portability. It leaves more of the automated incident-discovery and operational workflow to the team than managed platforms do.
3. LangSmith Engine: best recurring-issue-to-pull-request automation
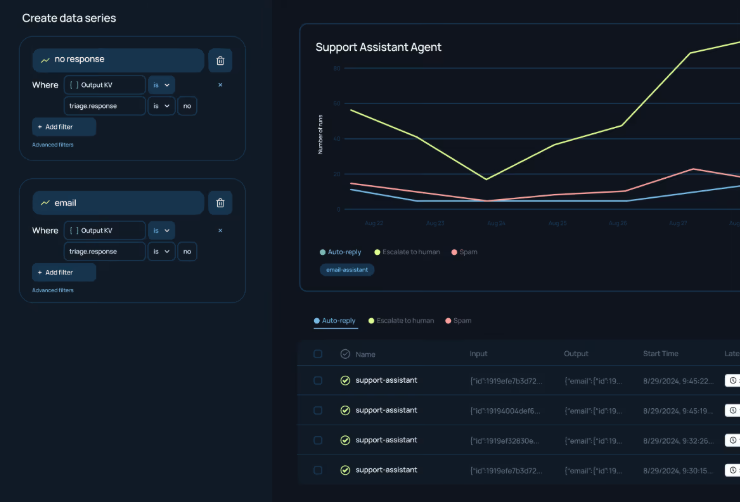
Best for: Teams that want the most integrated documented issue, evaluator, dataset, and pull-request loop, especially when LangChain or LangGraph already structures the application.
LangSmith Engine is in Beta. It scans a tracing project every six hours by default, and teams can change the frequency or pause scanning. Engine creates recurring issues with priority, linked traces, a root-cause diagnosis, a proposed fix, a suggested evaluator, and candidate offline examples. If the evaluator fires after an issue is closed, Engine can automatically reopen it.
From one issue, a reviewer can inspect supporting traces, create an online evaluator, add generated examples to a dataset, and open a pull request in a connected GitHub repository. Current documentation says Engine can propose code changes to any connected repository, including applications built with Deep Agents, LangChain, and LangGraph. LangChain and LangGraph still produce the most natural integration and execution structure, so custom-harness teams should test result quality rather than assume equivalence.
Engine currently lets a workspace choose a supported provider and supply its API key. That corrects an earlier version of this comparison that said Engine did not support customer-supplied provider keys. Buyers should still verify the supported provider and model combinations, key storage, data flow, and regional requirements.
Engine is the clearest example of why “has automated root-cause analysis” is no longer a useful checkbox. Its advantage is the durable closed loop: persistent issue, code context, pull request, evaluator, dataset example, and automatic recurrence detection.
What to validate
- Whether Engine reconstructs the application accurately from traces and repository context
- Whether issue categories and priorities match the team’s severity model
- Diagnosis quality for non-LangChain services and custom harnesses
- Supported providers, models, key management, data processing, and regional requirements
- Compute and model spend under representative trace volume
- Beta status and current plan availability
Tradeoff: Engine is highly capable but tightly integrated with the LangSmith operating model. Teams should evaluate cost, product status, and data-processing controls alongside the quality of its automation.
4. Comet Opik: best Apache 2.0 persistent issue queue with local repair
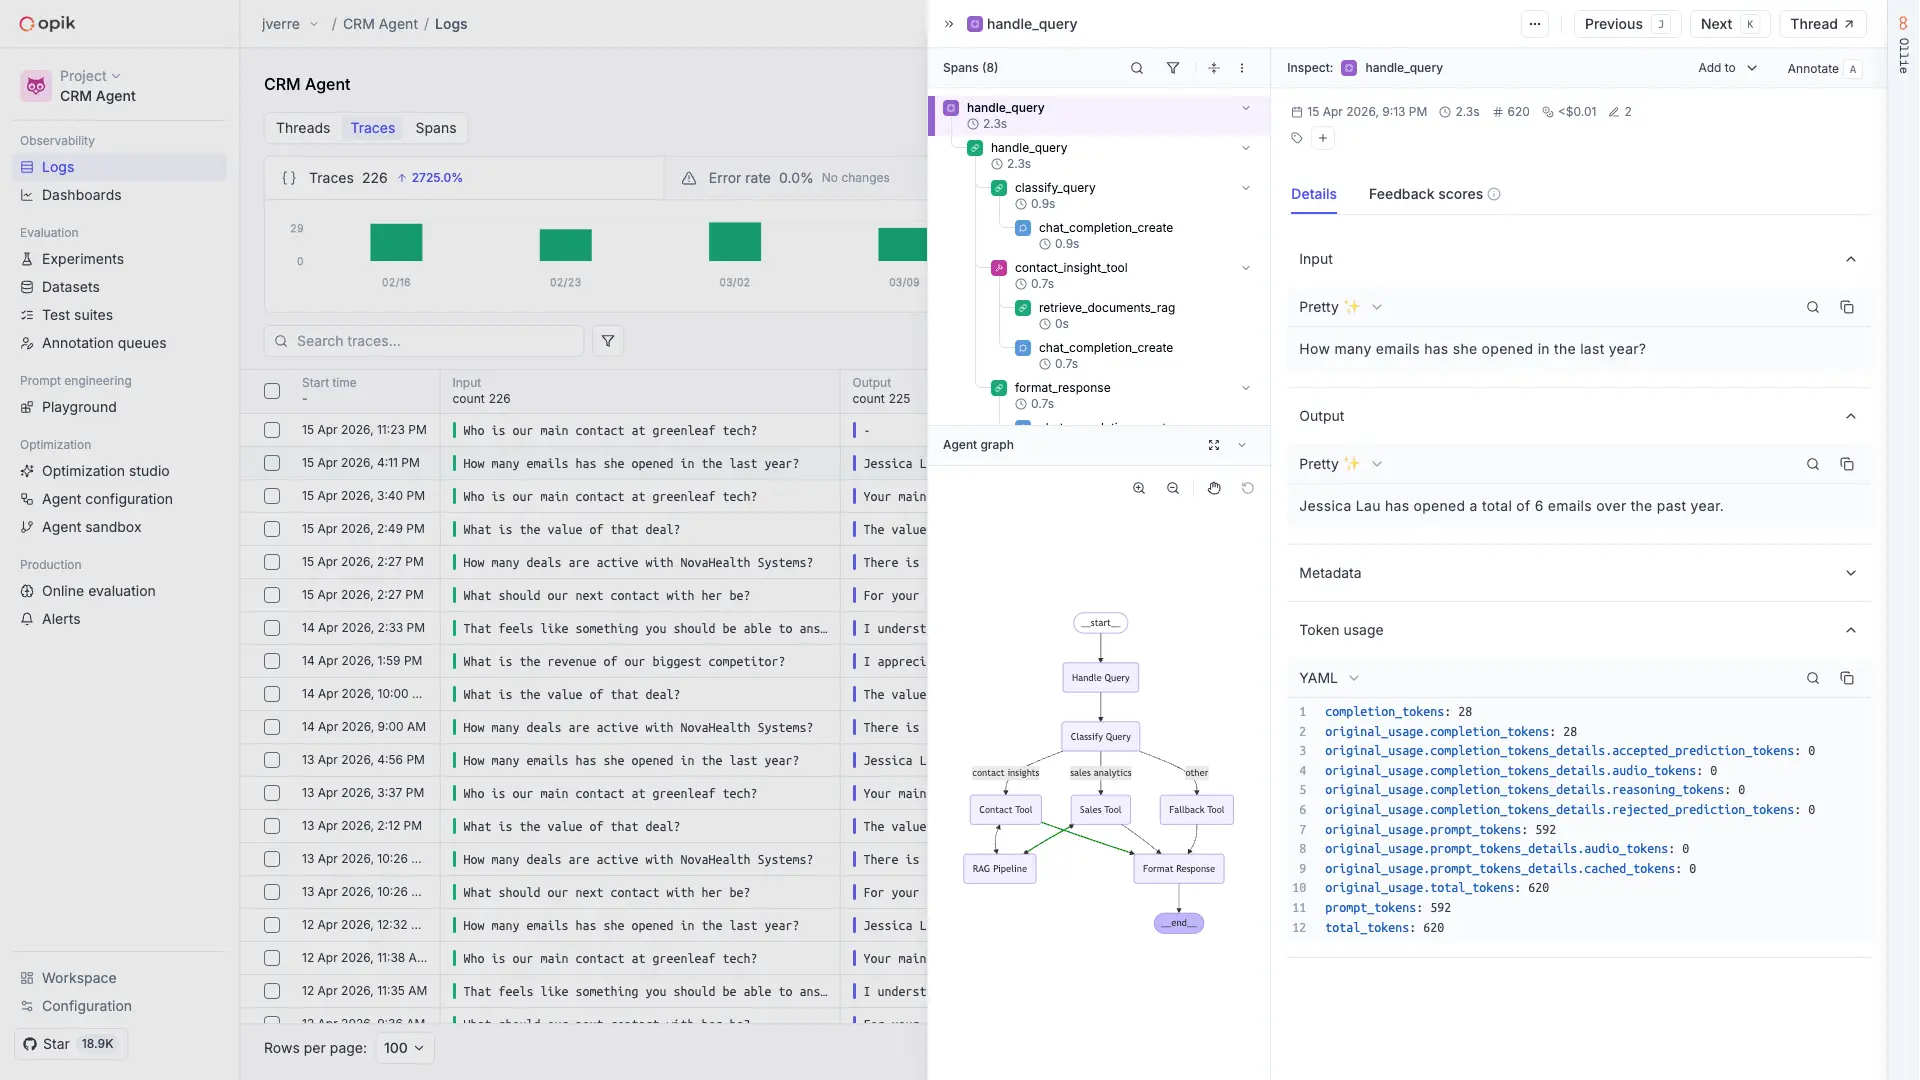
Best for: Teams that want scheduled failure discovery, an open-source Apache 2.0 core, thread-level evaluation, and a code-change workflow that remains on a developer’s machine.
Opik Diagnostics scans each project’s traces from the previous 24 hours every day at 00:05 UTC and can also run on demand. It groups matching failures into one issue and records severity, occurrence count, first and last seen, users impacted, a summary, likely root cause, suggested fix, occurrence history, and sample traces. Issues can be resolved and reopened.
That makes Diagnostics a real incident queue rather than a trace tag. It is powered by Ollie, requires Ollie to be enabled, and consumes Ollie tokens. The daily window and usage model should be tested against the team’s incident volume and retention requirements.
Ollie handles directed investigation and repair. When paired with opik connect, it can read source files in a locally connected project, propose an edit, rerun the agent with the original failing inputs, add the trace to a test suite, and execute that suite against the updated code. Every write requires approval, and the connection is scoped to the active local session.
This is a local approved-diff workflow, not a server-side pull request. The architecture keeps code access close to the developer and creates a tight interactive debugging loop. It’s less natural for an unattended on-call process in which an issue should become an asynchronous pull request for another engineer.
Opik also supports trace- and thread-level online evaluation, datasets, experiments, and targeted historical scoring. A team can encode a confirmed incident as a rule, apply it to selected earlier traffic, create regression cases, and validate a proposed change.
What to validate
- Whether the daily scan window captures the failure patterns that matter
- Deduplication quality and false-positive rates
- Ollie usage and cost under production volume
- The security and developer workflow for opik connect
- Whether local reproduction accurately represents production dependencies and state
- Which managed AI capabilities are included in the selected deployment or plan
Tradeoff: Opik’s Apache 2.0 core does not imply that every managed AI capability is free. Confirm current terms for Diagnostics, Ollie, and code-connected workflows.
5. Braintrust: best for evaluation-first production debugging
Best for: Product and engineering teams whose primary goal is to turn production failures into durable scorers, datasets, experiments, and CI coverage.
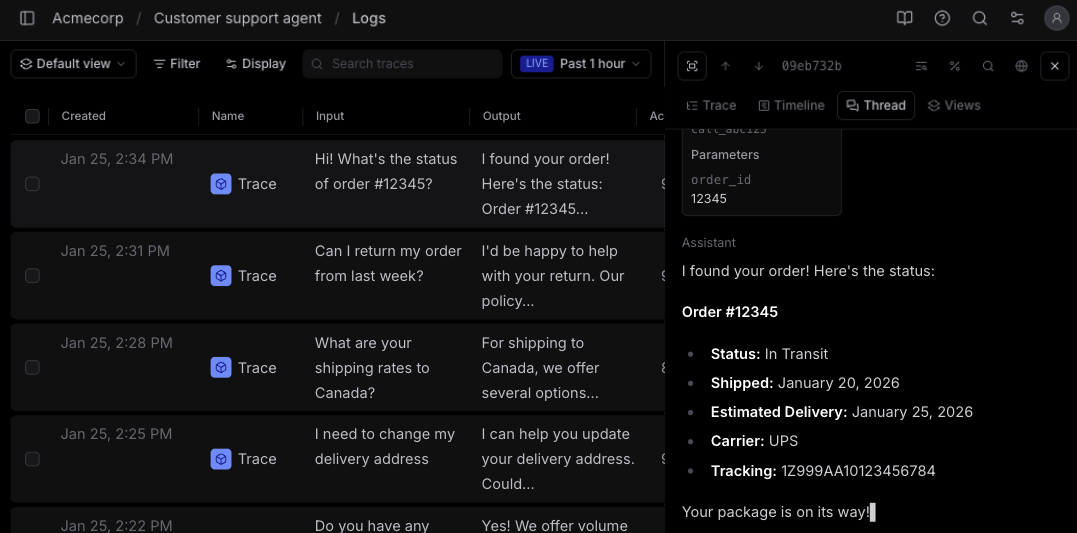
Braintrust stores production logs and experiments in a shared data model, making the path from an observed failure to an evaluation case unusually direct. Engineers can inspect nested traces, search spans, attach scores, promote examples into versioned datasets, compare application variants, and run the same evaluation suite in CI.
Topics adds unprompted cross-run discovery. The Beta feature processes new logs continuously, regenerates topics daily after enough summaries exist, and classifies traces across Task, Sentiment, Issues, and custom facets. The Issues facet can expose recurring tool failures, incomplete responses, and agent behavior that no existing scorer covered.
Topics creates named clusters and trace classifications rather than a persistent incident queue. Braintrust does not document the same severity, first-seen/last-seen, ownership, resolve, and automatic-reopen lifecycle like Arize Signal does.
Loop supports directed investigation. It can explain a trace, identify errors and performance issues, find semantically similar logs, generate filters and views, and help create scorers and datasets. Braintrust does not document a first-party repository workflow that proposes application-code changes. Its natural output is evaluation machinery, which is often the correct output for an evaluation-driven product team.
What to validate
- Topic quality on the team’s actual trace structure and vocabulary
- The data volume and time required before useful Topics emerge
- Stability of custom facets as product behavior changes
- How Loop’s diagnoses compare with expert review
- Data-plane deployment, residency, and operating responsibilities
- Scoring, model, and processed-data cost at production volume
Tradeoff: Braintrust is strongest when debugging should end in a scorer, dataset, and CI gate. It is less complete when the required artifact is a persistent on-call issue and code-level remediation.
6. Langfuse: best MIT-licensed open-source debugging platform
Best for: Infrastructure-capable teams that want open-source tracing, live scoring, datasets, experiments, prompt management, and structured human review under an MIT license.
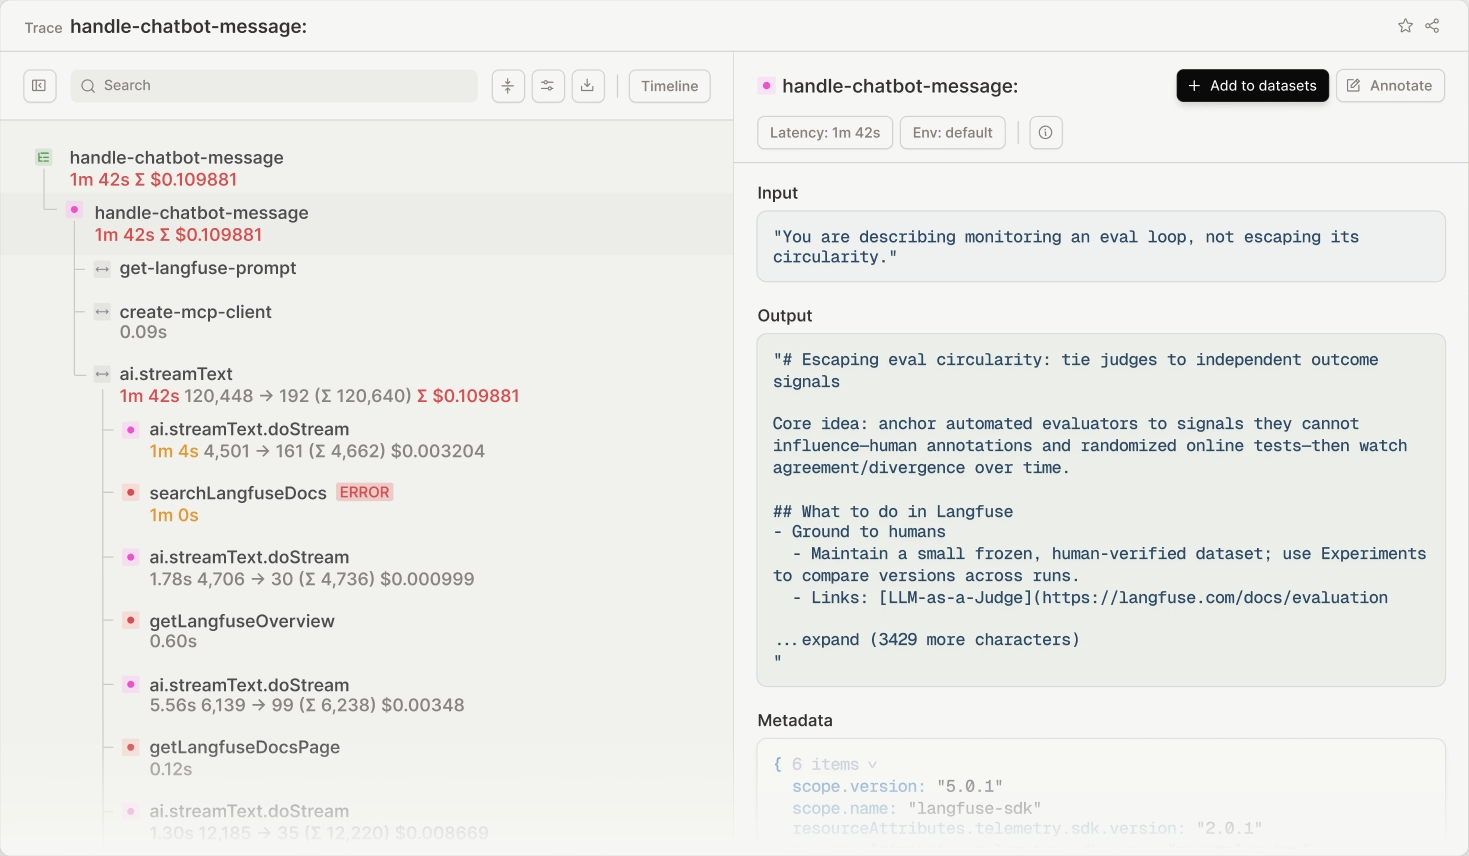
Langfuse captures traces through SDKs, framework integrations, decorators, and OpenTelemetry. Its Agent Graphs visualize multi-step workflows inferred from trace structure or LangGraph integrations. The graph view is Beta and should be tested with long, parallel, and multi-agent trajectories.
Langfuse supports LLM-as-a-judge and code evaluators, scores on traces and sessions, annotation queues, datasets, experiments, prompt management, and CI workflows. Those capabilities can be helpful when moving from a confirmed production incident to reviewed regression coverage.
Langfuse does not document an autonomous production scanner that continuously groups failures into persistent issues with severity and recurrence history. Discovery remains primarily driven by scores, filters, dashboards, and reviewers.
The Langfuse Assistant is a Cloud-only Public Beta feature that can answer questions about traces, sessions, observations, and metrics and help create selected Langfuse resources with explicit approval. It is an on-demand project assistant rather than a managed production incident scanner, and it is not available in self-hosted deployments.
Langfuse states that all product features are open source under MIT, while a narrower set of advanced governance features is commercial. That makes Langfuse the clearest permissively licensed alternative when MIT terms are an explicit procurement requirement.
What to validate
- Long-trajectory and agent-graph fidelity
- Online evaluation throughput and cost
- Human-review workflow and annotation agreement
- The work needed to build cross-trace clustering and incident routing
- Which governance features require commercial licensing
- Self-hosted storage, upgrades, backup, scaling, and access control
Tradeoff: Langfuse offers a broad open-source foundation, but teams must build the scheduled discovery and persistent issue layer themselves.
7. Galileo: best for failure discovery plus runtime control

Best for: Teams that want unknown failure patterns to become evaluators and runtime policy, with an IDE handoff for remediation.
Galileo Signals analyzes production traces to surface recurring patterns that a team did not encode in a metric or query. Galileo describes Signals as retaining historical context so new examples can be matched to known findings rather than appearing as unrelated reports.
Signals is closely connected to evaluation. A confirmed pattern can become an evaluator, creating a direct path from an unknown production failure to a metric and regression criterion. Galileo also provides agent-specific metrics for tool selection, tool errors, trajectory flow, efficiency, reasoning, and conversation behavior.
The code-change path is an IDE handoff rather than a first-party pull request. Galileo’s MCP integration can provide recent Signals, root-cause analysis, and suggested fixes to an IDE or coding agent. The external coding agent then inspects the repository and proposes the change.
Galileo further differentiates through Agent Control, an open-source runtime control plane that can enforce policies across agent inputs and outputs. This is useful when a detected behavior should not only be measured but blocked, steered, warned on, or logged while a durable fix is developed.
Public product language is less explicit about a resolve, assign, and automatic-reopen lifecycle for Signals than the documentation for Signal, Engine, and Diagnostics. Buyers should distinguish durable, deduplicated findings from a full incident-management object.
What to validate
- Recall and false-positive rates for unknown failure patterns
- How Signals represent recurrence, severity, ownership, and resolution over time
- Whether generated evaluators separate the real failure from nearby successful behavior
- Whether the MCP handoff contains enough trace and code context for safe remediation
- Runtime policy latency, failure behavior, and auditability
- Deployment and plan requirements for the selected configuration
Tradeoff: Galileo’s center of gravity is the discovery-to-evaluation-to-control loop. Teams that require a persistent issue queue and server-side pull request should compare AX and LangSmith directly.
8. Datadog Agent Observability: best for AI and infrastructure correlation
Best for: Teams already using Datadog for production operations that need to connect an agent’s behavioral failure to services, databases, queues, network calls, deployments, and infrastructure health.
Datadog now belongs in an agent-debugging comparison on its own merits. Agent Observability captures agent and LLM traces, including workflows, tool calls, and custom application spans, and correlates them with the broader Datadog telemetry stack.
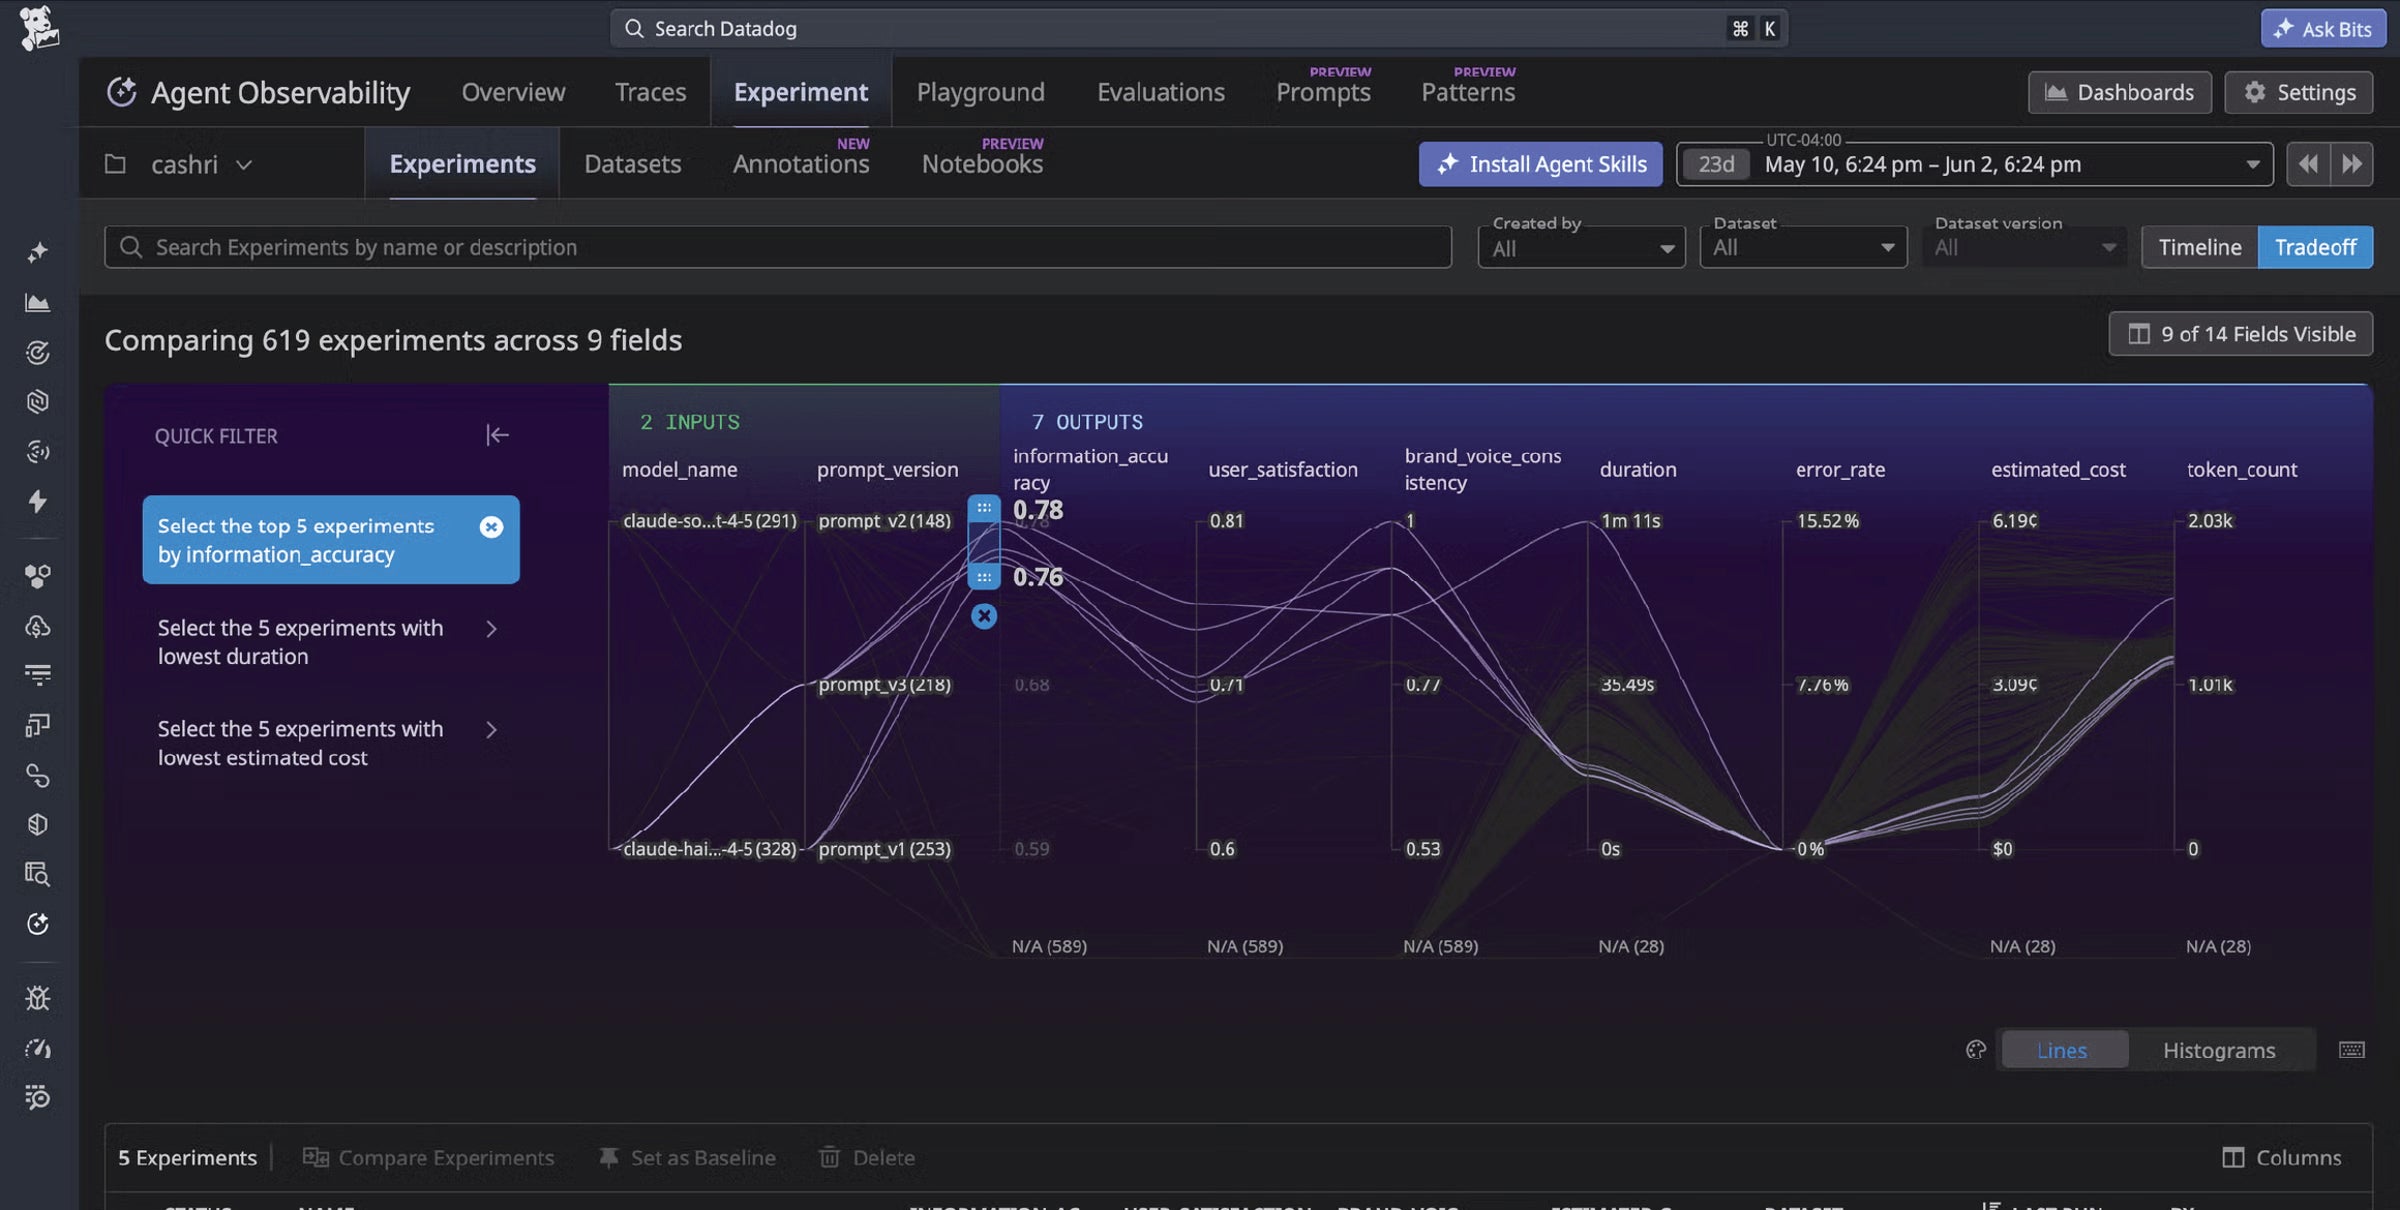
Patterns clusters selected production interactions into interpretable topics using summarization, embeddings, and machine-learning clustering. Teams can use Patterns to understand user requests, identify evaluation coverage gaps, and diagnose categories of failed interactions. A Pattern is a clustering result rather than a persistent incident with a resolve-or-reopen lifecycle.
Automation Rules continuously route new matching spans into datasets or annotation queues. This supports a practical loop: isolate a cohort, send representative examples for review, define an evaluation, and maintain a production-derived dataset.
Datadog’s main advantage is correlated context. An engineer can determine whether an agent’s bad decision coincided with a model error, slow service, database failure, rate limit, malformed tool response, or particular deployment. That combined view is difficult to recreate when AI traces and infrastructure telemetry live in separate systems.
What to validate
- Whether traces preserve enough agent semantics across service boundaries
- How Patterns handle long, tool-heavy, and multi-turn sessions
- The path from a cluster to a durable incident and regression workflow
- Dataset and annotation routing at expected traffic volume
- Retention and cost for verbose tool inputs and outputs
- Whether external coding-agent integrations preserve evidence and review controls
Tradeoff: Datadog offers a strong investigation substrate and cross-stack correlation. Agent Observability doesn’t document a first-party persistent-issue-to-server-side-PR loop.
9. W&B Weave: best for teams already using Weights & Biases
Best for: Teams that want production agent behavior connected to existing W&B prompts, models, datasets, evaluations, code versions, and experimentation workflows.
W&B Weave traces versioned operations and calls with inputs, outputs, timing, parent-child relationships, and errors. Its agent-oriented model includes sessions, turns, steps, tools, and subagents, helping reviewers follow long and multi-agent executions.
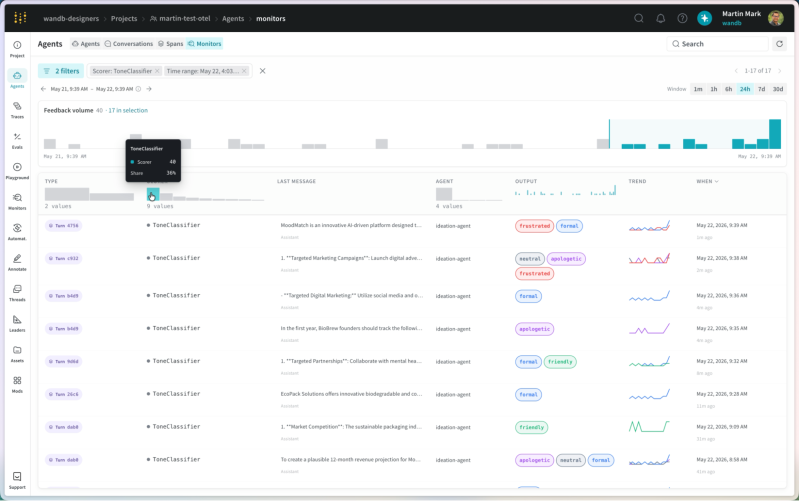
Weave emphasizes built-in and custom signals that classify production behavior and can trigger Slack or webhook automations. The main advantage is lineage. When W&B already stores models, datasets, evaluations, artifacts, and code versions, a team can connect a production regression to the development artifacts behind the release without rebuilding that context manually.
W&B Skills and the W&B MCP Server give coding agents programmatic access to experiments, traces, evaluations, reports, and documentation. A coding agent can analyze failures and iterate using Weave evidence, but that is different from a documented first-party scanner that creates a persistent issue and opens a pull request.
What to validate
- Whether built-in signals cover domain-specific failure modes or require custom classifiers
- The path from a classification to a dataset, evaluator, experiment, and release gate
- Trace lineage across the models, prompts, code, and datasets used in production
- SDK parity for production languages
- Ingestion, storage, and inference cost for verbose traces
- Self-managed infrastructure requirements and operational ownership
Tradeoff: Weave is compelling when W&B already owns development lineage. Teams must connect its analysis and agent interfaces to their own incident-management and code-review systems.
Which tool should you choose?
Choose Arize AX for recurring agent improvement loops
AX fits teams that need recurring cross-traffic discovery, persistent issues, open-standard instrumentation, evaluation and experiment workflows, and an Enterprise path to a reviewable repository change.
Choose Arize Phoenix for open-source control and portable debugging
Phoenix fits teams that want to run an open-source debugging and evaluation platform locally or on their own infrastructure. It is strongest when engineers need detailed trajectory analysis and are prepared to operate the surrounding alerting, clustering, and incident process.
Choose LangSmith Engine for the tightest issue-to-PR loop
Engine fits teams that value a deeply integrated persistent issue, pull request, evaluator, dataset example, and recurrence workflow. LangChain and LangGraph teams receive the most natural experience, although any connected repository can be used for proposed code changes.
Choose Comet Opik for Apache 2.0 plus local code repair
Opik fits teams that want persistent daily Diagnostics issues, an Apache 2.0 core, and an approved code-edit workflow on a developer’s machine rather than a server-side pull request.
Choose Braintrust when the desired output is evaluation coverage
Braintrust fits product teams that want Topics and Loop to turn production behavior into scorers, datasets, experiments, and CI checks rather than a traditional incident queue.
Choose Langfuse when an MIT open-source stack is the requirement
Langfuse fits infrastructure-capable teams that want broad tracing and evaluation product features under MIT and are willing to build their own recurring-failure discovery and incident-management layer.
Choose Galileo when runtime policy matters
Galileo fits teams that want unknown-failure discovery to generate evaluators and runtime controls that can block or steer future behavior while the underlying system is repaired.
Choose Datadog when AI incidents must correlate with the rest of production
Datadog fits organizations that already use it for APM and need agent traces to sit next to application, service, database, network, and deployment telemetry.
Choose W&B Weave when lineage is the advantage
Weave fits teams that already use Weights & Biases and want production agent behavior connected to the models, prompts, datasets, artifacts, and evaluations that produced it.
How to test an AI agent debugging tool with a real incident
A feature checklist might show you a capability exists on paper. But the best demos should show you if a product actually solves your problems.
When you’re trying a tool, try to prioritize at least three real cases:
- Tool failure: The agent chose the wrong tool, passed invalid arguments, mishandled a successful response, or failed to recover from an API error.
- Trajectory failure: The agent looped, retried without progress, skipped a required step, lost state, delegated incorrectly, or stopped too early.
- Outcome mismatch: The final response claimed success while the external system remained incomplete, incorrect, or unauthorized.
For each case, establish a baseline and measure:
- Time to the first defensible failure hypothesis
- Percentage of the relevant trace, external state, and version context available to the investigator
- Recall of affected sessions or blast-radius coverage
- False-positive rate at the issue, signal, or cluster level
- Evidence supporting the proposed root cause
- Time to create a reviewed regression case
- Time to compare a candidate change against a broader suite
- Reviewer acceptance rate for proposed evaluators and code changes
- Recurrence detection lag after deployment
- Cost per 1,000 traces and per investigated issue
- Exportability of traces, scores, datasets, annotations, and issue history
And then try running tests that most polished demos conveniently leave out. Need ideas? You could always start with something small like:
Withholding the question
A directed assistant looks capable when the engineer points it at a known bad trace. Feed the product a representative window of production traffic without naming the suspected failure and see what it surfaces. This tests discovery rather than query answering.
Breaking the evaluator
Create a case in which a judge or rule returns an obviously questionable score. Confirm that the platform exposes the evaluator input, prompt or code, model, evidence, and execution trace. A debugging platform should make its own scoring inspectable rather than asking the team to treat every score as ground truth.
Common mistakes when choosing a tool or platform
Treating a trace viewer as a complete incident system
A trace viewer explains one run. That’s it. It doesn;t automatically identify which failures recur, whether several symptoms share one cause, how much traffic is affected, or whether a fix prevented recurrence.
Evaluating only the final answer
An agent can produce a plausible response after a wrong tool call, bypassed approval, redundant retries, stale retrieval, or incomplete state change. Evaluate the outcome, trajectory, decisions, and reliability across repeated runs. The agent-native evaluation framework covers those scopes in detail.
Instrumenting the model but not the harness
The model is one component. Capture retrieval, tool contracts, orchestration, state, permissions, handoffs, retries, stop conditions, and verified external outcomes. Missing tool responses or flattened spans can make a cause unrecoverable after an incident.
Assuming an LLM judge supplies a verified root cause
A judge can classify a behavior or score a criterion. Root-cause analysis also needs trace context, affected cohorts, version metadata, external state, and often application code. Treat generated diagnoses as evidence-backed hypotheses that require review.
Turning a trace into a test without defining the contract
A production trace is evidence. A regression test also needs the expected outcome, allowed behavior, relevant state, and an evaluator that fails for the intended reason.
Buying automated investigation before fixing trace quality
Every automated investigator is downstream of instrumentation. A scanner cannot recover tool arguments, state transitions, or external outcomes that were never captured.
AI agent debugging FAQ
What is the best AI agent debugging tool for production?
Under the production-incident criteria in this guide, Arize AX is the best overall fit for teams that need recurring cross-traffic discovery, persistent issues, open-standard instrumentation, evaluation and experiment workflows, and a managed path to a reviewable repository change. LangSmith Engine is the strongest alternative when the priority is the most complete documented issue-to-pull-request automation.
What is the best open-source AI agent debugging tool?
Arize Phoenix is the best open-source AI agent debugging tool for teams that want portable OpenTelemetry and OpenInference tracing, evaluations, datasets, experiments, prompt workflows, PXI-assisted investigation, and full control over where telemetry is stored. Phoenix can run locally or be self-hosted with no feature gates.
Which tools automatically find recurring agent failures?
Arize Signal, LangSmith Engine, Opik Diagnostics, Braintrust Topics, and Galileo Signals all perform cross-run discovery, but they create different artifacts. Signal, Engine, and Diagnostics create persistent issues. Braintrust Topics creates named classifications across Task, Sentiment, Issues, and custom facets. Galileo Signals creates durable findings that can become evaluators. Datadog Patterns clusters selected production traffic, while W&B signals classify interactions.
Which AI agent debugging tools can propose code changes?
Arize Managed Agents and LangSmith Engine can open pull requests in connected repositories. Opik Ollie can propose an approved edit to a local working copy through opik connect. Galileo can hand findings and suggested fixes to an IDE through MCP. Phoenix, W&B Weave, Datadog, and other platforms can expose evidence to coding agents, but that is different from a first-party persistent-issue-to-pull-request workflow.
How is AI agent debugging different from evaluation?
Evaluation determines whether behavior met a defined criterion. Debugging explains why it failed and identifies a change worth testing. Evaluation can find suspicious traces at scale; traces, external state, version metadata, and code provide the evidence for diagnosis.
What should an AI agent trace capture?
Capture user input, final output, model calls, retrieval queries and results, tool names and arguments, tool responses, state changes, routing decisions, handoffs, retries, exceptions, latency, token use, prompt and agent versions, release metadata, and any verified external outcome.
Do I need OpenTelemetry to debug AI agents?
No, but OpenTelemetry improves portability and makes it easier to correlate AI behavior with distributed systems. OpenInference adds AI-specific semantic conventions for model, retrieval, tool, and agent spans. A proprietary SDK can still work, but export and migration should be tested before the platform becomes operationally critical.
Can APM tools debug AI agents?
APM remains essential for service health, database performance, network failures, and deployment correlation. Agent-aware traces are still required to determine whether an agent chose the right tool, used valid evidence, followed policy, and completed the user’s goal. Datadog Agent Observability demonstrates how the two telemetry layers can be combined rather than treated as alternatives.
How do you turn a production failure into a regression test?
Preserve the trace and relevant external state, verify the failure, define the expected outcome and behavioral boundaries, add the case to a versioned dataset, attach an evaluator, and run the current and proposed versions against the same test. After deployment, apply the same criterion to production traffic to detect recurrence.
Start with the problem your team really struggled with
Seriously. It really helps to bring one really difficult agent bug, issue, or problem you’ve had to a tool and see what it can do with it. Measure whether the platform reconstructs the trajectory, finds related failures, identifies the responsible decision or component, creates regression coverage, and detects recurrence. Compare the result with the team’s existing baseline and operating constraints.
For scheduled investigation across production traffic with a managed platform, follow the Signal workflow in Arize AX. For open-source trace, evaluation, and trajectory analysis with a platform that prioritizes local hosting, start with Arize Phoenix.

