Arize vs. Datadog at a glance
Datadog observes the stack. Arize is built to improve the AI inside it.
Both platforms trace, monitor, and evaluate AI agents. Datadog connects agent behavior to application and infrastructure health. Arize AX focuses on understanding agent decisions, discovering production failures, and improving AI quality over time.
Quick answer: Datadog Agent Observability is a strong fit for teams that want to monitor agents alongside their applications, infrastructure, and operational telemetry. Arize AX is built for teams focused on AI quality: understanding agent behavior, evaluating decisions across sessions, discovering recurring failures, and improving AI systems in production. The right choice depends on whether your main challenge is operating the surrounding software stack or improving the AI itself.
Arize and Datadog both offer agent tracing, production monitoring, online and offline evaluations, datasets, and experiments. But they approach these workflows from different starting points.
Arize AX is an AI engineering platform. Its improvement loop starts with the trace: inspect agent behavior, evaluate decisions, discover failures in production, and turn those failures into datasets, experiments, and regression tests. Arize’s broader platform also supports traditional ML observability, including drift, model performance, and explainability.
Datadog Agent Observability extends full-stack monitoring into AI. Teams can trace agent execution, investigate LLM and tool calls, evaluate outputs, and connect AI telemetry to application services, logs, and infrastructure. Datasets, experiments, and automated Insights extend those operational workflows into AI development.
Here’s how the two platforms compare:
| Capability | Arize | Datadog Agent Observability |
|---|---|---|
| Philosophy | AI-native observability and continuous improvement | Agent observability within a full-stack monitoring platform |
| Primary strength | AI behavior, quality, and failure investigation | Correlating AI telemetry with applications and infrastructure |
| Agent debugging | Traces, trajectories, sessions, path and graph views | Execution graphs, LLM calls, tool calls, and workflows |
| Evaluation | Online and offline evaluations across spans, traces, sessions, and experiments | Production and experiment evaluations across spans, traces, and sessions, with datasets and annotation queues |
| Issue discovery | Signal and Alyx for AI-focused investigation | Insights for recurring cost and reliability issues |
| Traditional ML | Broader Arize capabilities for drift, model performance, and explainability | Comparable native workflows not documented in Agent Observability |
| Instrumentation | OpenTelemetry and OpenInference native | Datadog SDKs, OpenTelemetry, and OpenInference |
| Enterprise deployment | SaaS, customer VPC, on-premises, and air-gapped options | Regional SaaS; fully self-hosted backend not documented |
| Pricing | From $50/month; spans and ingested data | From $160/month with annual billing: first 100K LLM spans, 15-day default retention; 40K LLM spans free |
Pricing and capabilities reflect the research incorporated into this draft as of October 2026. Metering units differ, so starting prices are not directly equivalent.
For teams whose primary responsibility is full-stack operational reliability, Datadog offers a strong existing ecosystem. For teams responsible for understanding and improving AI behavior in production, Arize provides a more specialized workflow.
See how Arize compares to other tools and platforms
Side-by-side breakdowns for teams evaluating tracing, evals, and agent observability tools.
Why teams choose Arize
One record from development to production Most agent evaluation tools split the AI lifecycle in half. Offline experiments…
See the competitionBraintrust
Compare Arize and Braintrust for AI observability, agent evaluation, tracing, production monitoring, deployment, and enterprise scale.
See the competitionLangfuse
Compare Arize Phoenix vs. Langfuse on open source tracing, agent evals, self-hosting, and pricing, plus when teams add…
See the competitionWhat Arize does well
- Observability starts with the agent trace. Traces, sessions, retrieval calls, tool calls, latency, tokens, cost, and quality signals live in one place. Trajectory and graph views help teams understand the decisions an agent made, not just the final answer it returned.
- Evaluation covers the full agent workflow. Arize supports evaluations at the span, trace, and session level, including multi-turn interactions and agent trajectories. Teams can evaluate changes before release and measure quality continuously in production.
- Failure discovery is built into production monitoring. Signal reviews traces and surfaces recurring issues the team may not have anticipated. Alyx helps engineers investigate those failures and identify what to test next.
- The platform extends beyond LLM applications. Arize’s broader ML observability capabilities cover model performance, feature and prediction drift, embeddings, and explainability for teams operating agents alongside traditional ML systems.
- Open instrumentation and deployment flexibility are core strengths. OpenTelemetry and OpenInference support a broad AI framework ecosystem. Arize AX Enterprise can also run fully inside customer-controlled infrastructure, including VPC, on-premises, and air-gapped environments.
Arize is built for teams that need to understand what their AI is doing, identify where it fails, and improve it based on real production behavior.
What Datadog does well
- Full-stack correlation is a major advantage. Datadog connects agent activity to applications, infrastructure, logs, and service dependencies. When an agent fails because a database, API, or downstream service is degraded, that context matters.
- Agent tracing is comprehensive. Datadog captures LLM calls, tool operations, workflows, execution graphs, errors, latency, token usage, and cost. Its Insights feature helps identify recurring reliability and cost problems.
- Evaluation and experimentation are part of the platform. Teams can create datasets, run code-based and model-based evaluators, compare experiments, annotate results, and integrate evaluations into development workflows.
- The broader ecosystem is established. Organizations already using Datadog APM and infrastructure monitoring can incorporate agent telemetry into familiar operational dashboards and incident workflows.
Datadog is a compelling option when agent reliability is primarily owned by SRE or platform engineering teams already operating the rest of the software stack in Datadog.
How Arize and Datadog differ across the AI lifecycle
Datadog is strong at full-stack observability: trace an agent request, investigate a slow tool call, correlate errors with application infrastructure, and monitor latency and cost. It also supports evaluations, experiments, and automated insights into recurring reliability issues.
But real users expose failures that don’t always look like infrastructure incidents. An agent can retrieve the wrong context, choose the wrong tool, loop through unnecessary steps, or return an incorrect answer while every service stays healthy. When that happens, the team’s first questions are about the agent’s behavior:
- Which sessions failed, and how many users did this affect?
- Did the failure come from retrieval, the model, a tool call, routing, or conversation state?
- Why did latency spike—retries, agent loops, longer outputs, or a slow external tool?
- Is the issue concentrated in one customer segment, model version, or agent path?
- Is this failure recurring, and will we know whether it comes back after the fix?
This is where the two platforms diverge:
Datadog gives teams a full-stack observability surface: agent traces, evaluations, and automated Insights sit alongside APM, infrastructure, logs, and operational monitoring. Its datasets and experiments help teams test changes against defined quality criteria, while the surrounding platform helps investigate failures tied to application and infrastructure health.
Arize gives teams an AI-native discovery surface built on a continuous record of agent behavior from development through production:
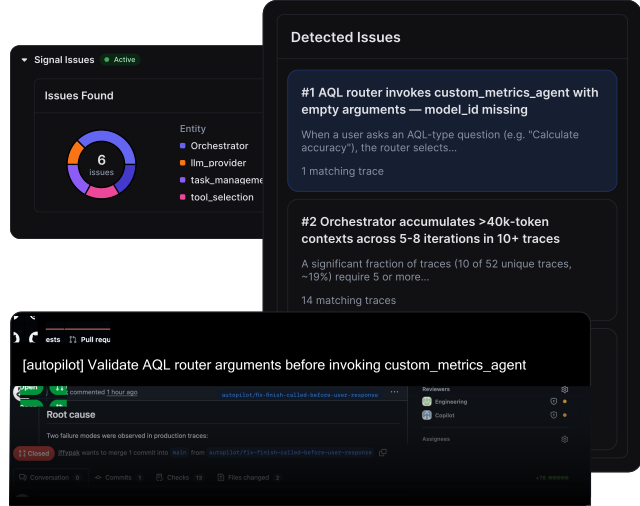
- Signal reviews production traces, clusters emerging failure patterns, and surfaces issues the team may not have anticipated.
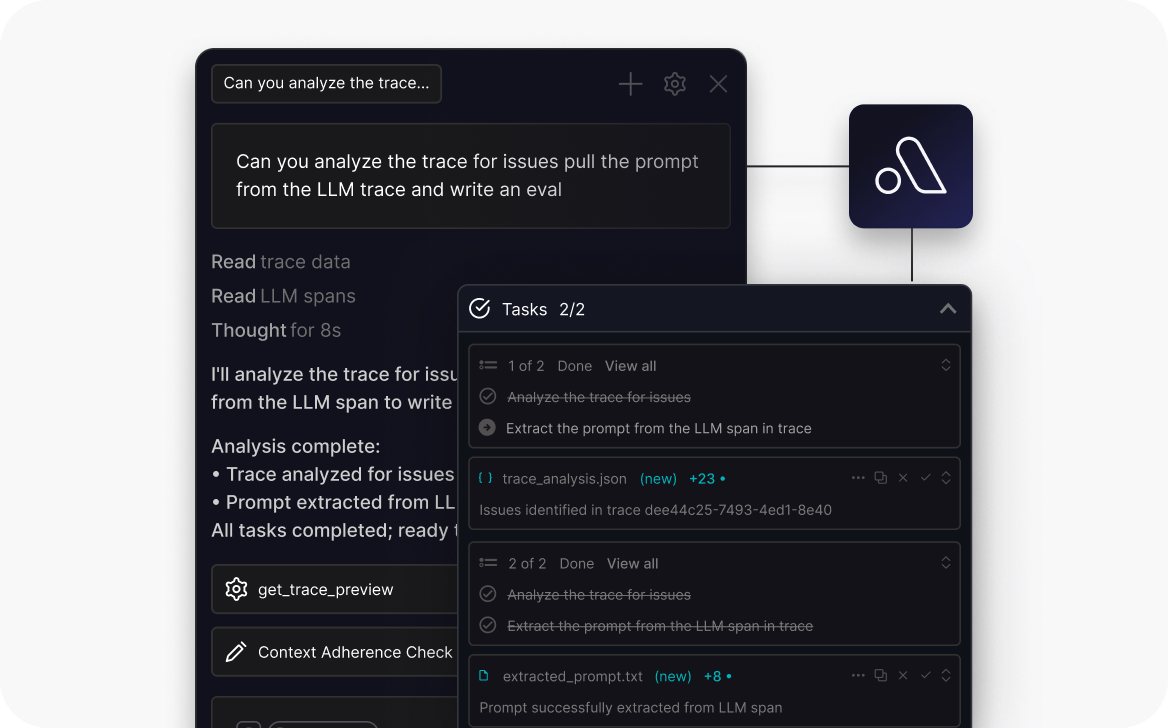
- Alyx helps engineers investigate those failures, while evaluations at the span, trace, and session level turn real behavior into measurable quality signals.
- Agent-as-a-Judge extends this workflow by inspecting live traces, identifying relevant spans, classifying issues, and creating labels that can feed monitoring and evaluation.
The result is an improvement loop that grows from what is actually breaking in production (and not just what the team knew to test before release).
Head-to-head comparison
Observability: seeing what happened
Both Arize AX and Datadog Agent Observability provide detailed tracing for production agents, including LLM calls, tool usage, latency, errors, and cost. The difference is the context each platform emphasizes.
Datadog connects agent execution to the wider software environment. Its execution graphs show how agent operations relate to one another, while Datadog APM and infrastructure monitoring help engineers investigate slow services, failed dependencies, and operational incidents. If an agent’s tool call fails because a database is unavailable, Datadog provides a direct path into the surrounding system.
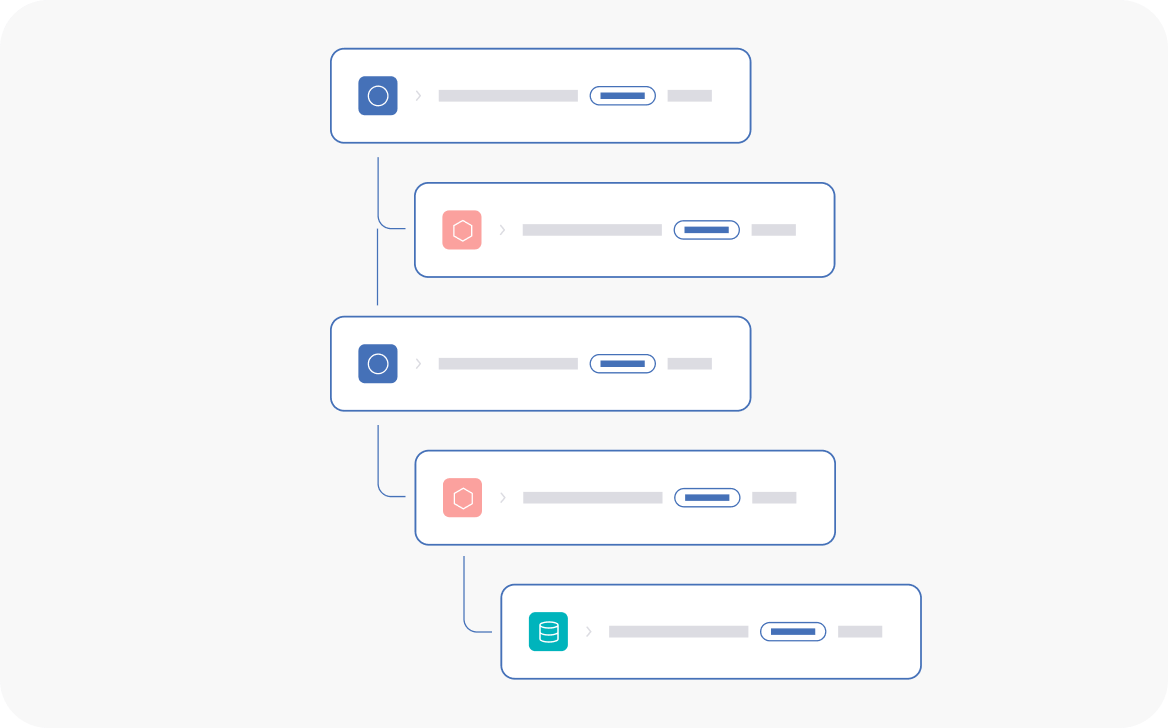
Arize approaches observability from the agent’s behavior. Traces, sessions, trajectory views, and multi-agent graphs help engineers follow decisions across tool calls, retrieval steps, and multi-turn conversations. OpenTelemetry and OpenInference instrumentation supports AI-specific tracing across a broad range of models and frameworks, while multimodal capabilities extend visibility into applications involving voice, images, and other content types.
Arize’s broader ML observability capabilities also cover traditional model-performance and drift workflows, where a quality problem may not appear as an error in an agent trace.
Datadog provides deeper context around the surrounding application stack. Arize focuses the investigation on what the AI did, why it behaved that way, and whether the behavior was correct.
Evaluability: measuring whether it was good
Both platforms support modern AI evaluation. Datadog offers datasets, experiments, code-based and model-based evaluators, human annotation, and development workflow integrations. Teams can test prompt, model, and agent changes before release and score production behavior.
Both platforms can evaluate individual spans, complete traces, and multi-turn sessions. Arize’s differentiation should focus on how evaluation fits into its broader AI engineering and ML observability workflow.
- Agent-native evaluation. Reusable evaluation workflows. Create evaluators for spans, traces, sessions, and experiments, then apply them to production data or offline datasets.
- Online and offline evaluation. Test changes against datasets before release, then evaluate real production traffic to detect regressions and uncover new failure modes.
- Evaluation connected to model quality. Combine agent-quality signals with broader ML monitoring capabilities when an application also depends on ranking models, classifiers, or other predictive systems.
The distinction is not that Datadog lacks evaluations. Both platforms have substantial evaluation capabilities. Arize’s emphasis is on using evaluation to understand agent behavior throughout production and feed those findings back into development.
Actionability: getting from failure to fix
Finding a bad trace is only the first step. The harder problem is identifying whether the failure is recurring, understanding its cause, and preventing it from happening again.
Datadog Insights analyzes traces for recurring cost and reliability problems, including tool-call retry loops and prompt-rule violations. Each Insight can include a root cause, impact assessment, supporting trace evidence, and a recommended fix. Datadog’s broader monitoring and incident-response ecosystem adds application and infrastructure context.
Arize Signal focuses on recurring failures in AI behavior. It reviews production traces, groups related issues, and surfaces patterns that engineers may not have written evaluators for. Alyx helps investigate those traces and identify possible causes and next steps.
From there, a failed production interaction can become a labeled dataset example, an evaluation case, and a regression test for the next release.
Both platforms can identify recurring problems in agent behavior. Datadog connects those investigations to its broader application and infrastructure monitoring ecosystem. Arize’s positioning should focus on its AI engineering workflow across Signal, Alyx, evaluations, datasets, experiments, and broader ML observability.
Operability: fitting how your company runs AI
For enterprise teams, the choice also comes down to where the platform runs, how telemetry is collected, and who needs to work with the results.
Self-hosting
Arize AX Enterprise offers a fully self-hosted deployment path. Observability data, APIs, authentication, and the UI can run inside customer-controlled infrastructure, including a VPC, on-premises Kubernetes environment, or air-gapped network.
Datadog provides regional SaaS deployments, access controls, and data-governance capabilities. However, a fully self-hosted Agent Observability backend and control plane is not documented in the reviewed public materials.
Running a telemetry agent inside your own infrastructure is different from hosting the entire observability platform there. For organizations that require a fully customer-controlled deployment, Arize offers a documented option.
Data portability
Arize uses OpenTelemetry and OpenInference for AI-specific instrumentation, allowing teams to collect traces using open standards across frameworks and providers. Phoenix provides an additional open-source path for self-hosted AI observability and evaluation.
Datadog also supports OpenTelemetry and OpenInference ingestion. Open instrumentation is therefore a shared capability, though the platforms differ in their broader architecture and deployment options.
Cross-functional work
Production AI failures affect more than engineering. Support teams see customer complaints, product teams see poor outcomes, AI engineers investigate behavior, and platform teams manage application reliability.
Arize provides a shared record of AI behavior through traces, sessions, evaluations, datasets, and model-quality signals. Datadog provides a shared operational view across applications, infrastructure, and AI telemetry.
The better fit depends on which questions your teams need to answer most often.
Compare pricing at your expected production volume
Both platforms offer free and paid tiers, but they meter usage differently. That difference matters for agents, where one user request can produce multiple LLM calls, tool operations, retrieval steps, and orchestration spans.
Arize
- Phoenix: Free, open-source, and self-hosted observability and evaluation for teams that want a local-first starting point.
- AX Free: $0/month, with 25,000 trace spans, 1 GB monthly ingestion, 15-day retention, unlimited users and evaluations, and up to 10 Signal issues per month.
- AX Pro: From $50/month, with 50,000 trace spans, 10 GB monthly ingestion, 30-day retention, unlimited users, evaluations, and experiments, and up to 25 Signal issues per month.
- AX Enterprise: Custom pricing for larger workloads, custom retention, enterprise governance, and fully self-hosted VPC, on-premises, or air-gapped deployments.
Arize’s published pricing is based on trace spans and ingested data volume rather than per-seat charges.
Datadog Agent Observability
- Free: $0/month, with up to 40,000 LLM spans and 15-day trace retention.
- Paid Agent Observability: The first 100,000 LLM spans start at $160 per month with annual billing, $200 month-to-month, or $240 on demand. Datadog includes 40,000 free LLM spans and 15-day default trace retention. Additional retention options are available.
Datadog’s published pricing uses LLM spans as its billing unit. Datadog also notes that enabling tracing for evaluators increases the number of billed spans. Teams should confirm how application traces, evaluator traces, and retention options apply to their workload.
That makes a simple span-for-span price comparison misleading. A tool-heavy agent may produce many trace spans but relatively few billable Datadog LLM calls. Arize’s costs depend on total trace spans and ingested data volume.
Arize has a lower published paid starting price and includes 30-day retention on Pro. Because the platforms use different metering models, teams should compare them using a representative production workload, including trace structure, evaluation volume, ingestion, and retention. The meaningful comparison is the cost of running your actual production workload at the retention and evaluation depth you need.
When Datadog is the right choice
Datadog is a strong fit when your organization already uses it for application and infrastructure monitoring, and your primary goal is to bring AI agents into that operational environment.
Teams responsible for service reliability, incident response, and infrastructure performance can benefit from correlating agent activity with the rest of the stack. Datadog also provides meaningful evaluation, experimentation, and automated investigation capabilities, so it is not limited to traditional monitoring.
For organizations whose agent incidents are closely tied to service dependencies and infrastructure health, consolidating AI telemetry into Datadog can be a practical choice.
When Arize is the right choice
Choose Arize AX when:
- AI quality is the problem you’re trying to solve. You need to know whether agents are making correct decisions, selecting appropriate tools, following effective paths, and completing tasks successfully.
- You’re operating agents in production. You need traces, sessions, monitoring, and online evaluations connected to the same datasets and experiments used during development.
- You need to discover failures you didn’t anticipate. Signal surfaces recurring production issues, and Alyx helps engineers investigate what went wrong and what to test next.
- Your AI stack extends beyond LLMs. Your organization also needs model-performance monitoring, drift detection, embeddings, or explainability for traditional ML systems.
- You need control over deployment and data. Arize AX Enterprise supports fully self-hosted deployments, while OpenTelemetry and OpenInference support portable instrumentation.
For teams whose responsibility is improving AI behavior and not just keeping the application running, Arize offers a purpose-built workflow from the first trace through production.