

Chapter summary
Last updated on August 13, 2026.
Arize publishes this comparison and includes its own products. The guide compares publicly documented capabilities. Product capabilities, deployment options, and pricing change frequently, so teams should validate shortlisted platforms against their own applications and requirements.
For teams comparing the broader observability and evaluation category, see our broader Arize alternatives comparison.
Quick answer
An AI agent evaluation platform should do more than score a final LLM response. It needs to evaluate what happened across the complete run: which tools the agent selected, the arguments it passed, the path it followed, whether it recovered from errors, what happened across a multi-turn session, and whether the task actually succeeded.
The seven platforms in this comparison take different approaches. Arize AX is built for enterprise teams connecting agent evaluation with production observability and online evaluation. Phoenix is suited to teams that want self-hosted evaluation and tracing. LangSmith fits teams building primarily with LangChain and LangGraph. Braintrust connects production traces, datasets, experiments, scorers, and CI/CD in an eval-driven development loop. Langfuse combines open-source LLM engineering workflows with tracing and evaluation. W&B Weave fits teams already using Weights & Biases. Comet Opik provides a self-hosted, agent-oriented evaluation option under Apache 2.0.
Ok, now let’s jump in.
What is an AI agent evaluation platform?
An AI agent evaluation platform is software for measuring whether an agent completes its assigned task correctly and behaves as expected while doing so. Unlike evaluation of a single LLM response, agent evaluation may need to inspect retrieval, tool selection, tool arguments, handoffs, retries, state changes, multi-turn context, latency, cost, and the final outcome of the task.
That creates several possible evaluation scopes. A team may evaluate one span or tool call, a complete trace, the trajectory of actions within that trace, a multi-turn session, or behavior across a dataset of repeated runs. The right scope depends on what can actually fail in the application.
A complete evaluation platform may include:
- Tracing and observability for model calls, retrieval, tools, agents, and application code
- Datasets and versioned test cases
- LLM-as-a-Judge, deterministic, embedding-based, and custom evaluators
- Agent-as-a-Judge for nuanced, multi-step evaluations that require an agent to explore full trace context, assess trajectories, and apply complex rubrics
- Offline experiments and regression testing
- Online evaluation of production traffic
- Human review and annotation workflows
- Dashboards, monitors, alerts, and release gates
- Prompt management and replay
- APIs, SDKs, CI/CD integrations, and agent-accessible tools
- AI engineering agents to help surface issues, build evaluators, and improve AI applications and agents
The terms evaluation platform, evaluation framework, and evaluation harness are related, but they describe different parts of the stack.
| Term | What it provides | Examples |
|---|---|---|
| Evaluation library or framework | Metrics, test runners, judge prompts, dataset utilities, and code that can run locally or inside CI. | Phoenix Evals, DeepEval, Ragas, Promptfoo, lm-evaluation-harness |
| Evaluation platform | A shared system for traces, datasets, experiments, evaluators, human review, production monitoring, and collaboration. | Arize AX, Phoenix, LangSmith, Braintrust, Langfuse, W&B Weave, Opik |
| Evaluation harness | The standardized infrastructure that determines what gets evaluated, how it gets scored, and what happens after the result. | A connected workflow spanning traces, evaluators, review queues, experiments, alerts, and CI/CD |
These categories overlap. Phoenix, for example, includes both a platform and an evaluation library. LangSmith and Braintrust combine tracing with experimentation. Several self-hosted products also offer managed cloud and enterprise extensions. Our explainer on what an evaluation harness is covers the distinction in more depth.
At a glance: For agent applications, the deciding capability is usually whether the platform can connect evaluation scores to the observable execution that produced them and carry the same quality criteria from offline experiments into production.
Build better agents with Arize
Trace, evaluate, and learn. Build agents that work with Arize AX and start tracing your runs today.
Prefer open source? Try Arize Phoenix for self-hosted, open source agent observability.

Best AI agent evaluation platforms at a glance
Shortlist options before the detailed criteria below. We offer a more comprehensive table view further below in this article.
| Platform | Primary orientation | Deployment | Offline eval | Online eval on production traffic | Trajectory-level eval | Starting price |
|---|---|---|---|---|---|---|
| Arize AX | Production observability with evaluation | Managed / enterprise self-hosted | Yes | Yes | Yes | Usage-based; see pricing page |
| Arize Phoenix | Open-source tracing and evaluation | Self-hosted or local | Yes | Limited | Yes | Free, self-hosted |
| LangSmith | LangChain / LangGraph tracing and evals | Managed / self-hosted on higher tiers | Yes | Yes | Yes | Free tier; paid by trace volume |
| Braintrust | Eval-driven development and production observability | Managed / BYOC / self-hosted data plane | Yes | Yes, asynchronous | Yes | Free tier; usage-based paid plans |
| Langfuse | Open-source LLM tracing | Self-hosted or cloud | Yes | Partial | Partial | Free, self-hosted; cloud tiers available |
| W&B Weave | Evaluation inside W&B | Managed | Yes | Partial | Partial | Included with W&B plans |
| Comet Opik | Open-source agent evaluation | Self-hosted or managed | Yes | Partial | Partial | Free, self-hosted |
Verify current pricing and capabilities on each vendor’s site before shortlisting.
How we evaluated these platforms
Arize reviewed publicly available product documentation as of August 2026. We compared deployment options, instrumentation, offline experimentation, evaluation on production traffic, supported evaluation units, human-review workflows, interoperability, and agent-accessible tooling. Arize publishes this guide and includes Arize AX and Phoenix. Capabilities and pricing change frequently, so readers should verify shortlisted products directly and test them against their own applications.
What makes agent evaluation different from LLM evaluation?
A final answer can look correct even when the agent reached it through a bad path. An agent can select the wrong tool and recover, repeat an expensive operation unnecessarily, skip a required approval, lose context halfway through a conversation, or claim that an external action succeeded when the underlying system never changed. Output-only evaluation can miss each of these failures.
Agent evaluation therefore needs to connect the outcome with the execution that produced it. Different failures require different evaluation scopes:
| Failure | What an output-only eval misses | What to evaluate |
| The agent produces the right answer after choosing the wrong tool | The final response still passes | Tool selection and tool arguments |
| The task succeeds through an unsafe or prohibited sequence | The final state looks correct | Trajectory |
| Individual turns look good but the agent loses context over time | Each response passes independently | Session or thread |
| The agent reports success but never changes the underlying system | The language sounds correct | Final system state and task outcome |
| One run succeeds but behavior varies substantially across retries | A single successful test looks healthy | Repeated-run reliability |
| The agent recovers only after unnecessary calls and retries | Task success hides wasted work | Recovery behavior, latency, and cost |
This is why trace and trajectory support matter when comparing agent evaluation platforms. The platform needs enough observable context to determine not only what the agent returned, but what it did.
Here, we zero in on seven platforms teams ask about most often and that lead in adoption. All can help you test agents, but they are built for different stages of the lifecycle.
What to compare in an agent evaluation platform
Evaluation at the right granularity
An evaluation platform should match the structure of the application being tested.
- Span-level evaluation measures one model call, retrieval, tool invocation, or application operation.
- Trace-level evaluation measures one complete request or agent run.
- Trajectory evaluation inspects the sequence of observable agent actions, including tools, handoffs, retries, and termination behavior.
- Session- or thread-level evaluation measures a multi-turn conversation or workflow spanning several requests.
- Dataset-level evaluation compares aggregate behavior across representative examples.
A tool-calling agent may require task success, tool selection, argument correctness, trajectory quality, and cost per successful task. A chatbot may require turn- and session-level evaluation. A RAG application needs separate retrieval and answer-quality measurements. Our guide to agent evaluation metrics covers how to define each of these.
The platform should not require access to hidden chain-of-thought. Focus on observable and reproducible evidence such as inputs, outputs, retrieval results, tool calls, structured plans intentionally emitted by the application, state transitions, errors, latency, token usage, and final outcomes.
Tool-call and trajectory evaluation
Tool use creates two distinct evaluation problems. The agent can select the wrong tool, or it can select the right tool and call it incorrectly. Those failures should be measured separately because they usually require different fixes.
Trajectory evaluation adds another layer. It asks whether the sequence of observable actions was acceptable as a whole: whether required steps occurred, prohibited actions were avoided, retries represented useful recovery rather than loops, and the agent terminated at the appropriate point.
When comparing platforms, test whether you can score these behaviors directly from a captured agent run rather than flattening the trace into a final prompt-response pair.
Multiple evaluation methods
No single evaluator can measure every kind of quality.
- Use deterministic code for schemas, exact values, required fields, tool arguments, safety rules, and known invariants.
- Use LLM-as-a-Judge for semantic criteria such as correctness, relevance, completeness, tone, and policy adherence.
- Use embedding or similarity methods when semantic distance is a useful proxy.
- Use Agent-as-a-Judge when an evaluation requires an agent to inspect traces, retrieve additional context, use tools, or investigate a multi-step trajectory before reaching a judgment.
- Use human review to establish ground truth and evaluate ambiguous, subjective, or high-risk behavior.
- Use agent-based evaluators when scoring requires retrieval, tools, or multi-step investigation.
A mature platform should let teams combine these approaches and use externally developed evaluators rather than limiting evaluation to first-party templates.
Offline and online evaluation
Offline evaluation and production evaluation solve different problems.
Offline evaluations run against controlled datasets before deployment. They help teams compare prompts, models, retrieval strategies, tools, and agent configurations while catching known regressions.
Online evaluations score production interactions. They surface changing user behavior, new edge cases, tool failures, retrieval drift, and regressions that were missing from the test set.
A strong evaluation workflow connects both environments:
- Run a change against a representative dataset.
- Approve or block the release using agreed thresholds.
- Evaluate sampled or filtered production traffic.
- Route failures to human review.
- Add validated failures to the regression dataset.
- Test the next proposed fix against the expanded dataset.
Teams formalizing this progression may find our maturity model for AI evaluation useful, along with guidance on adding LLM evaluations to CI/CD pipelines.
Evaluator traceability and human alignment
LLM judges are probabilistic systems and should be evaluated like any other model-based application.
A useful platform should preserve:
- The evaluator prompt or rubric
- The judge model and invocation parameters
- The context supplied to the evaluator
- The raw evaluator response
- The parsed label or score
- Latency, token usage, and cost
- The evaluator version used for each result
Teams should calibrate automated evaluators against labeled data, inspect disagreements, and measure agreement with domain experts before trusting an evaluator as a release or production gate. See judging the judges, how to build LLM-as-a-Judge evaluators that hold up in production, and our test of self-evaluation bias when the judge and the application share a model.
Datasets, experiments, and reproducibility
An evaluation result becomes more useful when it belongs to a reproducible experiment.
Look for support for:
- Dataset versioning
- Production traces converted into test cases
- Reference answers and expected tool calls
- Synthetic test-case generation
- Repeated runs for measuring variance
- Side-by-side experiment comparison
- Prompt, model, application, and evaluator version tracking
- CI/CD gates based on evaluation changes
The platform should show which application version, dataset version, evaluator version, and model configuration produced each score.
Human review workflows
Human feedback should be part of the evaluation system rather than an unrelated spreadsheet or ticket queue. See our guidance on annotation for strong AI evaluation pipelines.
Useful capabilities include:
- Dedicated annotation queues
- Reviewer assignments and permissions
- Single-example and pairwise review
- Written corrections and reference outputs
- Inter-annotator agreement analysis
- Routing based on filters, user feedback, errors, or low evaluator scores
- Dataset creation from reviewed examples
Open instrumentation and data access
Evaluation data often needs to move between application frameworks, observability systems, warehouses, notebooks, and business analytics tools.
OpenTelemetry provides a common transport and trace structure. OpenInference adds AI-specific conventions for models, retrieval, tools, agents, guardrails, and evaluators. Our overview of agent telemetry standards explains how the two fit together.
Open instrumentation reduces the cost of changing an agent framework or observability backend. It does not guarantee complete portability on its own, so teams should also review export APIs, data models, retention rules, and whether evaluation results can be accessed outside the product UI.
Deployment, security, and operating cost
Evaluate more than the initial developer experience.
- Which cloud regions are available?
- Can the platform run in a private cloud or on your own infrastructure?
- Which components remain vendor-managed?
- Are SSO, RBAC, SCIM, audit logs, masking, and retention controls included in the required plan?
- How are traces, media, prompts, and evaluation results stored?
- Can the platform access private models, APIs, and databases?
- How does pricing change with trace volume, retention, online evaluation, and judge-model usage?
- What infrastructure must your team operate when self-hosting?
Pricing comparisons should use the same ingestion volume, payload size, retention period, number of users, evaluator sampling rate, judge models, support tier, and deployment architecture. Our breakdown of the hidden economics of LLM evaluation costs covers the variables that most often surprise teams after rollout.
Agent-native workflows and automation
Evaluation platforms increasingly need to serve both human users and AI agents. Teams should be able to access traces, datasets, experiments, evaluators, and monitoring workflows through APIs, SDKs, CLIs, MCP servers, and integrations with coding agents or other agentic systems.
Strong agent-native capabilities allow an agent to investigate failures, query production traces, assemble datasets, draft or run evaluators, compare experiments, and recommend or configure monitors without requiring every step to happen manually in a web interface.
Look beyond whether a platform simply exposes an API. Consider whether agents can:
- Search and inspect traces, spans, sessions, and evaluation results
- Create or update datasets from production examples
- Run experiments and compare candidate changes
- Generate, test, and version evaluators
- Investigate regressions across multiple steps or tools
- Configure monitors, alerts, and recurring evaluations
- Work through the CLI, MCP, coding environments, or platform-specific agents
- Return structured, auditable results that can be reviewed before changes are applied
These workflows should still operate within a reproducible evaluation system. Agent-generated evaluators, datasets, and configuration changes should remain inspectable, versioned, permissioned, and testable against ground-truth examples. Agent access is most valuable when it shortens the path from detecting a failure to validating an improvement without weakening governance or human oversight.
Model and framework integrations
The LLM ecosystem moves fast with new model releases, frameworks, orchestration layers, and AI agent memory platforms popping up weekly. Evaluation tools need to integrate cleanly across inference providers and agent frameworks without custom code or adapters. True interoperability ensures your evaluation and observability pipelines continue to function effectively even as your stack (and the market) evolves.
Agent-assisted evaluation and automation
Some platforms now include AI assistants that help analyze traces, improve prompts, test datasets, design evaluations, and interpret results in context — for example, linking evaluation outcomes to business impact or product quality. A strong assistant should support planning of AI debugging tasks, execute workflows, help you debug your AI agents and help you improve your prompts.
Which LLM and agent evaluation platform is right for your team?
There is no universal best evaluation platform. The right choice depends on what you are evaluating, where evaluations need to run, how your team deploys software, and what must happen after a failure is detected.
Enterprise teams evaluating production agents may prioritize online evaluation, trajectory and session analysis, human-review workflows, governance, and long-term telemetry storage. Teams centered on LangChain or LangGraph may value LangSmith’s integrated ecosystem. Eval-driven product teams that want production traces to feed directly into evaluation and regression workflows may prioritize Braintrust. Teams seeking open-source and self-hosted options may shortlist Phoenix, Langfuse, or Opik. W&B users may prefer to connect application evaluation to their existing model-development workflows.
Use the comparison below to build a shortlist, then test each candidate against the same application, dataset, evaluators, and production failure cases.
The top LLM and agent evaluation platforms compared
| Platform | Deployment | Offline evaluation | Production evaluation | Human review | Strongest fit |
|---|---|---|---|---|---|
| Arize AX | Managed commercial platform | Datasets, reusable evaluators, experiments, and full-agent experiments | Evaluation on production spans, traces, trajectories, and sessions with filtering and sampling | Labeling queues and ground-truth datasets | Enterprise teams operating agents and LLM applications across development and production |
| Arize Phoenix | Self-hosted or managed cloud; self-hosting under ELv2 | Client- and server-side evaluations, datasets, experiments, and prompt replay | Evaluations can run against production traces; managed continuous monitoring and alerting are provided by AX | Human annotations on spans, traces, and sessions | Teams that want a self-hosted evaluation and observability workflow built on open telemetry |
| LangSmith | Cloud, hybrid, or self-hosted; hybrid and self-hosted require Enterprise | Datasets, experiments, human evaluation, code evaluators, LLM judges, and pairwise comparison | Online evaluators on runs and threads with filters, sampling, alerts, and automation rules | Single-run and pairwise annotation queues | LangChain and LangGraph teams seeking an integrated development workflow |
| Braintrust | Managed platform, BYOC, or self-hosted data plane | Versioned datasets, experiments, scorers, playground workflows, and CI/CD | Asynchronous online scoring on production traces | Assignments, structured review, corrections, and production feedback | Eval-driven teams connecting production traces, datasets, experiments, and CI/CD |
| Langfuse | Cloud or self-hosted; MIT-licensed core with commercially licensed enterprise directories | Datasets, experiments, LLM judges, code evaluators, and CI/CD | Evaluation rules, monitors, alerts, and scores on live observations | Annotation queues for observations, traces, and sessions | Teams seeking an open-source LLM engineering platform with cloud and self-hosted options |
| W&B Weave | Multi-tenant cloud, dedicated cloud, or self-managed | Datasets, evaluations, custom scorers, comparisons, and lineage | Production monitors and guardrails | Human feedback and annotation scorers | Teams already using Weights & Biases or connecting model development with application evaluation |
| Comet Opik | Cloud or self-hosted; Apache 2.0 licensed | Test suites, datasets, metrics, experiments, and prompt optimization | Online and on-demand evaluation of traces and threads | Annotation queues for traces and threads | Teams seeking a self-hosted, agent-oriented evaluation and optimization platform |
This table should create a shortlist rather than determine the final choice. The products overlap substantially, and the most meaningful differences often emerge only when the same application, evaluators, and production failure cases are tested in each platform. For a broader survey of the category, see our roundup of top LLM evaluation tools and our comparison of eval harnesses for production AI.
Arize also publishes head-to-head pages for several products in this list: LangSmith alternatives, Langfuse alternatives, and Braintrust alternatives. Those pages argue Arize’s position directly and should be read as vendor material rather than as part of this comparison.
Arize AX: Best for enterprise AI evaluation and observability
Arize AX is built for teams that need to evaluate and troubleshoot AI applications across the full development lifecycle, from offline experiments to production monitoring. It brings tracing, online and offline evaluation, human review, experimentation, and production observability into the same system, making it particularly well suited to organizations operating high-volume LLM and agent applications.
A key distinction is its use of open instrumentation standards. Arize AX is built around OpenTelemetry and OpenInference, so teams can capture standardized traces across models and application frameworks without tying their instrumentation to a proprietary tracing format.
Instrumentation with Arize AX
Arize AX supports OpenTelemetry and OpenInference auto-instrumentation across a broad set of model providers and AI application frameworks. For supported libraries, teams can begin capturing prompts, responses, tool calls, retrieval steps, latency, token usage, and other span-level data with a small amount of instrumentation code.
For example, an OpenAI application can be automatically traced with OpenInference and sent to Arize AX:
# pip install arize-otel

# Import open-telemetry dependencies
from arize.otel import register

# Setup OTel via convenience function
tracer_provider = register(
    space_id="your-space-id",  # in app space settings page
    api_key="your-api-key",  # in app space settings page
    project_name="your-project-name",  # name this to whatever you would like
)

# Import the automatic instrumentor from OpenInference
from openinference.instrumentation.openai import OpenAIInstrumentor

# Finish automatic instrumentation
OpenAIInstrumentor().instrument(tracer_provider=tracer_provider)
Example: using Arize AX and OpenInference to automatically trace OpenAI calls with OTel
What Arize AX is good for
- Evaluating agents at multiple levels. Agent failures rarely live entirely in the final response. AX lets teams evaluate individual spans, complete traces, trajectories, and multi-turn sessions, so they can measure behaviors such as tool selection, tool arguments, task completion, recovery from errors, coherence across turns, latency, and cost. This makes it possible to determine whether a bad outcome came from one model decision, a sequence of actions, or the overall agent strategy without relying on hidden chain-of-thought.
- Vendor-agnostic observability. Arize uses OpenTelemetry and OpenInference rather than a proprietary tracing format. Its instrumentation ecosystem covers major foundation-model providers and popular AI frameworks, which is useful for organizations running multiple models or changing providers over time. Teams can standardize how application telemetry is captured while keeping the underlying model and framework choices flexible.
- Agent-assisted troubleshooting with Alyx. Alyx is Arize’s AI agent for working with application telemetry and evaluations. Instead of moving manually between traces, annotations, evaluator configuration, and experiments, teams can use Alyx to investigate a failure, identify examples that exhibit the problem, build or refine an evaluator, test it against those examples, and turn the resulting evaluation into a reusable part of their workflow. The goal is to shorten the loop between finding a production problem and having a test that detects it.
- Production-scale telemetry and monitoring. AX is designed for high-volume production workloads rather than evaluation only in development environments. Its underlying Arize Database, or ADB, is purpose-built for AI telemetry, while real-time monitors allow teams to continuously evaluate production traffic and surface changes in application behavior as they happen. This becomes important when traces contain many spans or when evaluation needs to run across large volumes of requests.
- Online and offline evaluation in the same workflow. Teams can run evaluations against production traces as well as datasets used for development and experimentation. This supports a useful iteration loop: detect a failure in production, turn representative traces into test cases, develop or tune an evaluator, replay the test offline, and then deploy that evaluator back into production monitoring. AX also supports evaluations at the trace and session level, which is particularly relevant for agents whose quality cannot be measured from a single LLM response.
- Evaluation development. AX includes tools for building and validating LLM-based evaluators rather than treating the judge prompt as a black box (plus, an open-source eval library). Teams can use multi-criteria evaluations to score several dimensions with a single judge call, inspect evaluation results against example data, and use published benchmarks for built-in evaluation templates. Alyx can also help generate and iterate on evaluators, reducing the amount of prompt development required to get an initial evaluation working.
- Data control and long-term retention. AX is designed to fit AI telemetry into an organization’s existing data architecture. ADB supports Iceberg- and Parquet-based datasets and cloud-backed storage, allowing teams to retain large volumes of historical telemetry while making that data available to downstream analytics and data workflows. For enterprises that want AI observability data to remain part of a broader data lake architecture, this can be a meaningful advantage over systems that keep telemetry inside a separate proprietary store.
Limitations of Arize AX
- Less suited to small self-hosted deployments. AX is primarily designed for managed, production-scale environments. A team looking for a lightweight deployment inside a small VPC or on a single server may find Arize Phoenix, Arize’s open-source observability and evaluation platform, easier to operate.
- OTel can take a little more configuration: Arize uses OTel for instrumentation, which can require slightly more configuration than proprietary approaches. However, this tradeoff provides the benefit of adopting a standardized, open framework that aligns with the broader industry direction. Auto-instrumentation features ease initial setup and help reduce configuration overhead.
- Highly distributed data-residency requirements can require additional architecture. Organizations that need telemetry to remain isolated across many geographic regions may not want to operate a separate AX deployment in every region. In those environments, a hybrid architecture using Phoenix for localized workloads and AX for centralized evaluation and observability can provide more flexibility, but it also introduces additional deployment and governance decisions.
Arize Phoenix: Best open-source platform for self-hosted evaluation
Open source observability and evaluation for LLMs and agents — self-hosted, Otel-native, and built on the same open schema that powers Arize AX.
Instrumentation with Arize Phoenix (Open Source)
If you prefer to run evaluations and observability locally or self-hosted, Arize Phoenix offers an open source implementation of the same OpenInference schema used in Arize AX. It emits native OTel and accepts traces from any OpenInference-instrumented exporter.
With native OTel support, Phoenix makes sending telemetry as simple as registering a tracer and running your app.
from phoenix.otel import register

# configure Phoenix tracer
tracer_provider = register(
    project_name="your-llm-app",
    auto_instrument=True,
)

tracer = tracer_provider.get_tracer(__name__)
As with AX, Phoenix can also trace all calls to any supported libraries with auto-instrumentation. (OpenAI shown as an example.)
# pip install openinference-instrumentation-openai

import os
import openai

os.environ["OPENAI_API_KEY"] = "Input OpenAI key..."

client = openai.OpenAI()

response = client.chat.completions.create(
    model="gpt-4o",
    messages=[{"role": "user", "content": "Write a haiku about tracing."}],
)

print(response.choices[0].message.content)
Phoenix also supports TypeScript instrumentation, providing first-class OpenInference tracing for any Node or TypeScript environment.
What Arize Phoenix is good for
- Ease of deployment: Phoenix is lightweight and designed for quick iteration. With minimal dependencies and native OTel support, teams can instrument applications and begin capturing traces with only a few lines of code. This makes it well-suited for fast experimentation and iteration.
- Data control and speed of deployment: As an open-source, self-hosted solution, Phoenix lets teams deploy observability in minutes while retaining full control over where data is stored and processed — ideal for environments with strict data-residency or sovereignty requirements.
- Extensibility: Phoenix’s open architecture and extensible plugin system make it easy for developers to customize functionality, integrate new data sources, or build custom evaluators.
- Agent evaluation capabilities (compared with other open source tools): Compared with other open-source evaluation and tracing tools such as Langfuse, Arize Phoenix provides deeper support for agent evaluation. It captures complete multi-step agent traces, allowing teams to assess how agents make decisions over time. While other OSS frameworks focus primarily on tracing and visualization, Phoenix extends those capabilities to include structured evaluation workflows and integration paths to managed Arize AX deployments for production-scale observability and evaluation.
- Prompt management: The OSS core of Phoenix now includes a prompt management module (released April 2025) that lets teams create, version, store, and reuse prompt templates across models and workflows.
- Production-ready even before upgrading: The OSS core ships with async workers, scalable storage adapters, and a plugin system for custom eval judges. These features make it stable for sustained workloads, not just experimentation, allowing teams to run meaningful evaluation pipelines before adopting a managed service.
- Open-source control with the same trace schema used in Arize AX: Phoenix shares the same OpenInference trace schema as Arize AX, ensuring full compatibility between self-hosted and managed environments. Teams can start locally with complete control over infrastructure and later migrate seamlessly to AX without changing instrumentation or data models.
- OTel-first integrations and notebooks: Built natively on OpenTelemetry, Phoenix integrates easily into existing observability and analytics stacks. Evaluation results can be exported to notebooks, dashboards, or downstream BI tools, making it simple to extend Phoenix into broader analytical workflows.
Limitations of Arize Phoenix
- You manage the infrastructure: Teams lacking DevOps expertise may find upgrades and storage management distracting.
- Enterprise guardrails: Complete security and access controls, including SSO, RBAC, and audit trails, are enabled through Arize AX.
LangSmith: Best for LangChain and LangGraph teams
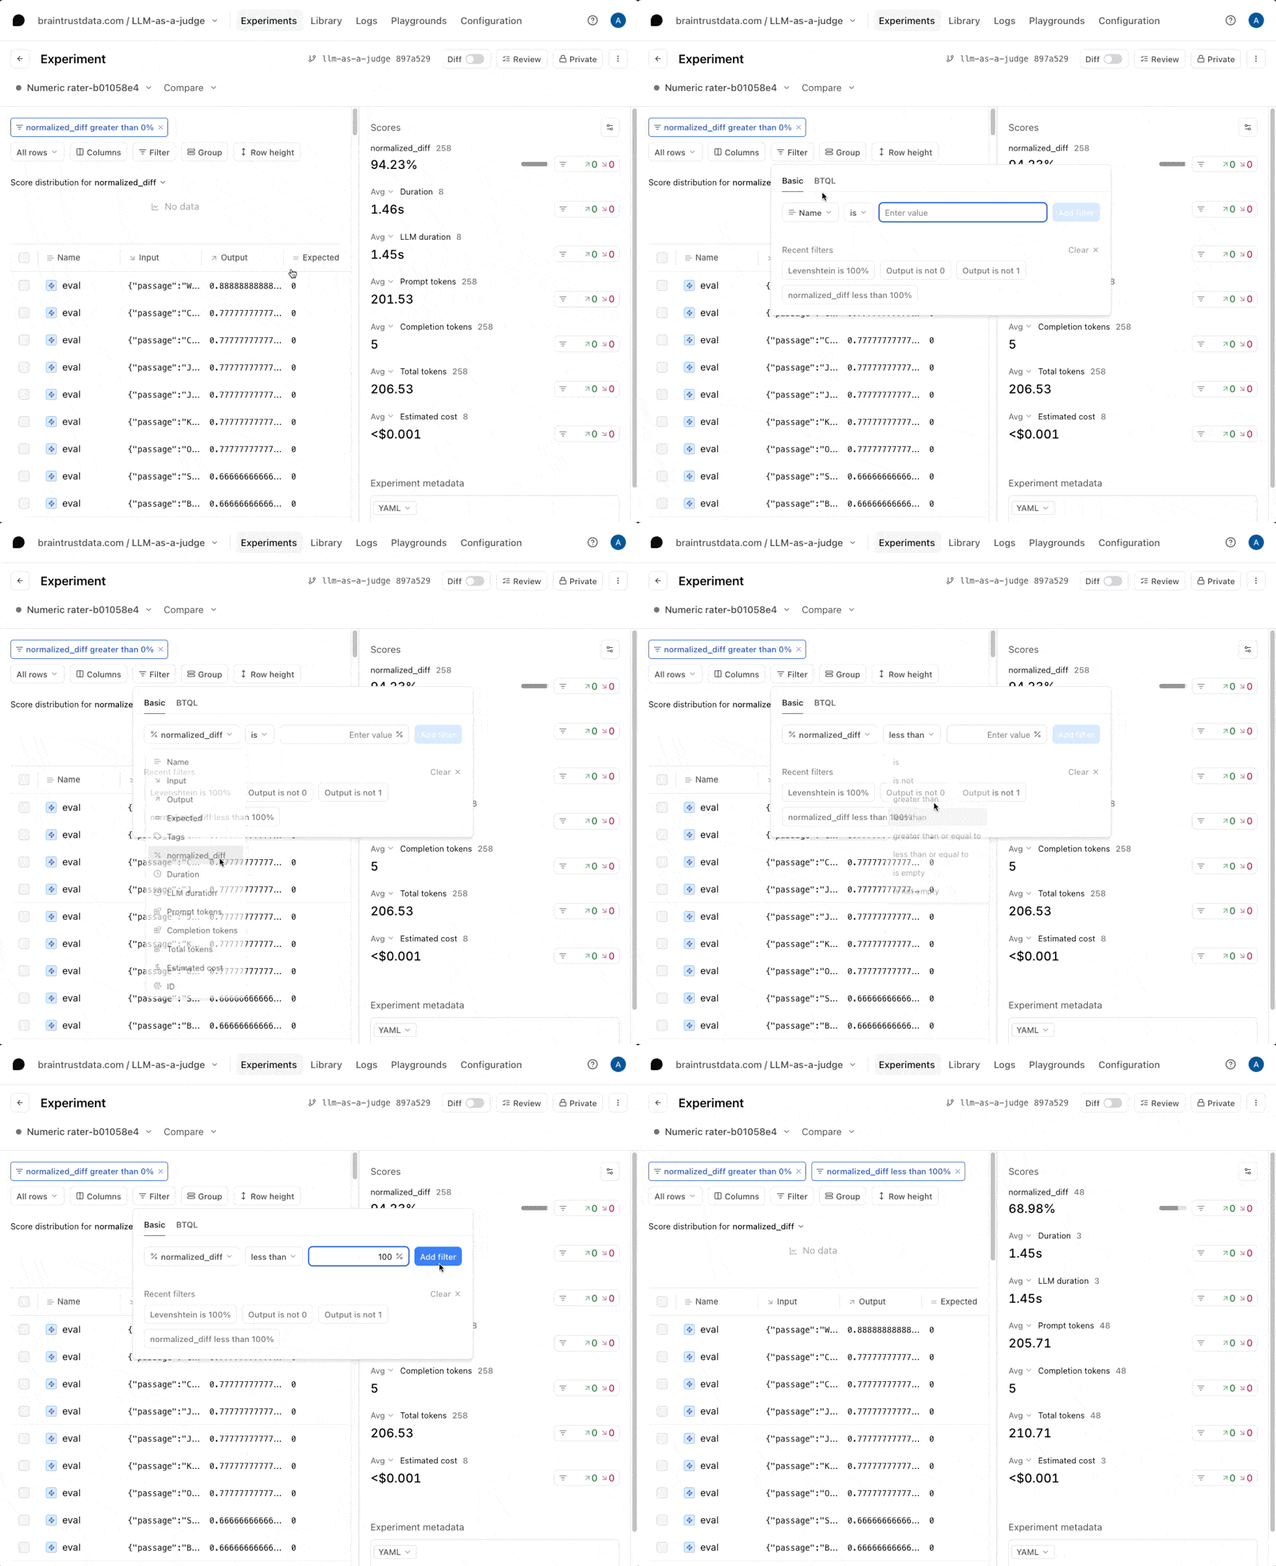
LangSmith is LangChain’s platform for observability, evaluation, prompt engineering, and agent deployment. It has particularly tight integrations with LangChain and LangGraph, while also accepting telemetry from applications instrumented with OpenTelemetry.
What LangSmith is best for
Teams using LangChain or LangGraph that want tracing, evaluation, prompt workflows, and deployment capabilities in one ecosystem.
Strengths of LangSmith
- Integrated LangChain workflow: LangChain and LangGraph applications receive native tracing and debugging support.
- Offline evaluation: Teams can build datasets from curated examples, production traces, or synthetic data and run human, code, LLM, or pairwise evaluators.
- Online evaluation: Evaluators can run on production runs or threads with filters and sampling rates.
- Human review: LangSmith supports single-run and pairwise annotation queues with rubrics, assignments, and reviewer tracking.
- Automation rules: Matching traces can be routed to queues, datasets, webhooks, evaluators, custom code, or alerts.
- OpenTelemetry: Non-LangChain applications can send OpenTelemetry traces to LangSmith and connect them to evaluation experiments.
- Deployment options: LangSmith supports managed cloud, hybrid, and self-hosted configurations.
Tradeoffs to validate
- The experience is most integrated for LangChain and LangGraph. Teams using other frameworks should test how much custom instrumentation and data mapping their applications require.
- LangSmith is closed source. Hybrid and self-hosted deployments are Enterprise-only and require a license key, so there is no route to self-hosting without an Enterprise contract.
- Review how traces, evaluator runs, retention, and automation rules affect pricing at production volume. Seat-based pricing plus trace overages can scale differently than volume-based models.
- Validate data export and portability requirements when LangSmith-specific datasets, feedback objects, prompts, or deployment capabilities become part of the workflow.
- Explore LangSmith evaluation
- Send OpenTelemetry traces to LangSmith
Braintrust: Best for eval-driven AI development
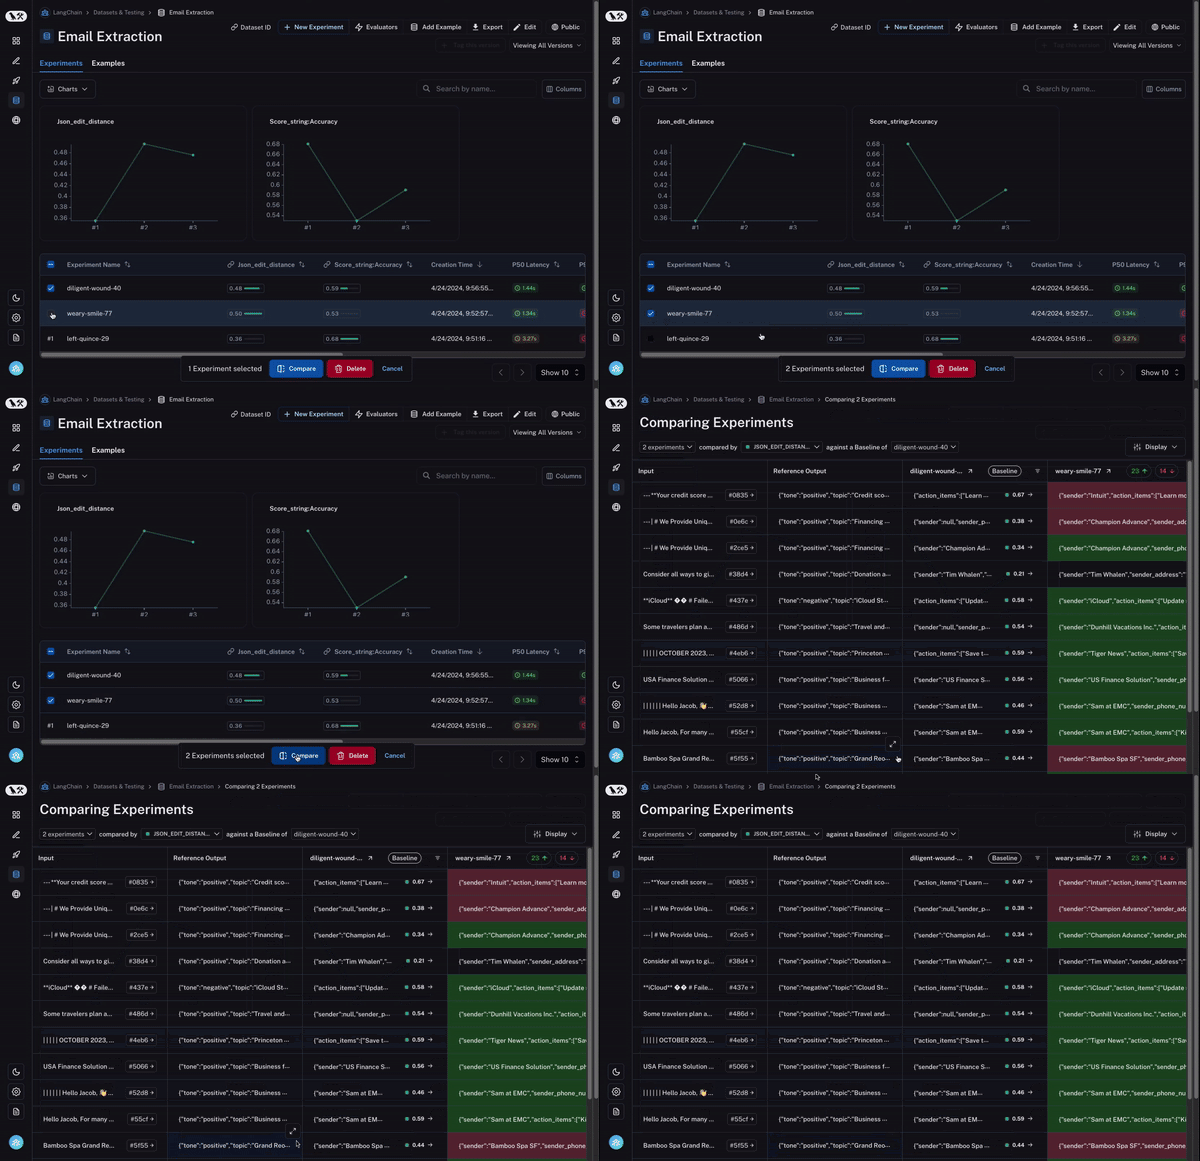
Braintrust is best suited to teams that want a tight feedback loop between production traces and evaluation. The platform combines datasets, experiments, scorers, playgrounds, CI/CD, human review, production tracing, dashboards, alerts, and asynchronous online scoring. Production traces can be inspected, scored automatically, and turned into datasets for regression testing.
Instrumentation with Braintrust
Braintrust supports application tracing through its SDKs and OpenTelemetry. It can receive standard OpenTelemetry exports, capture nested spans across model calls, tools, and application logic, and provide production trace inspection alongside dashboards and alerts. Tracing is now a core part of Braintrust’s observability and evaluation workflow.
Its deployment architecture is an important distinction. With Braintrust self-hosting, the customer operates the data plane that stores sensitive AI data, while Braintrust continues to provide the managed control plane, web UI, authentication, and platform updates. Teams that require the entire observability and evaluation platform to run inside their own environment should evaluate that boundary carefully.
What Braintrust is good for
- Eval-driven development: Versioned datasets, scorers, experiments, playgrounds, and CI/CD provide a structured workflow for testing changes and detecting regressions.
- Production-to-evaluation feedback loops: Teams can automatically score production traces, identify failures, and move real-world examples into datasets for future experiments and regression testing.
- Production observability: Braintrust provides searchable traces, dashboards, alerts, latency and cost metrics, quality scores, and tools for investigating production behavior.
- Human review and collaboration: Structured review workflows let engineers, product teams, and subject-matter experts score traces, experiments, and datasets and feed those judgments back into evaluation.
- OpenTelemetry interoperability: Teams can instrument with Braintrust SDKs or send traces using OpenTelemetry exporters and supported instrumentation libraries.
Limitations of Braintrust
- Asynchronous production scoring: Braintrust’s online scoring runs after production traces are logged and is designed to avoid adding application latency. This works well for monitoring and feedback loops. Teams that need evaluations or guardrails to block, retry, or modify an output before a live request completes should treat that as a separate requirement and test it explicitly.
- Self-hosting boundary: Braintrust’s self-hosted option places the data plane in the customer’s infrastructure, while the control plane, web UI, authentication, and platform management remain Braintrust-managed. Organizations that require the full platform to run inside their own cloud or private environment should compare deployment architectures carefully.
- Agent-specific operational workflows: Braintrust supports span-level, trace-level, grouped multi-trace scoring, and trajectory evaluation. Teams running complex multi-agent systems should test how well its investigation workflows represent handoffs, loops, execution paths, and long-running sessions rather than treating agent evaluation as a single feature checkbox.
- Retention and production economics: Data retention varies by plan. Teams generating high volumes of production traces should model retention requirements, evaluation volume, query patterns, and associated costs before standardizing on a platform.
- Explore Braintrust evaluations
- Score production traces
Langfuse: Best for open-source agent engineering workflows
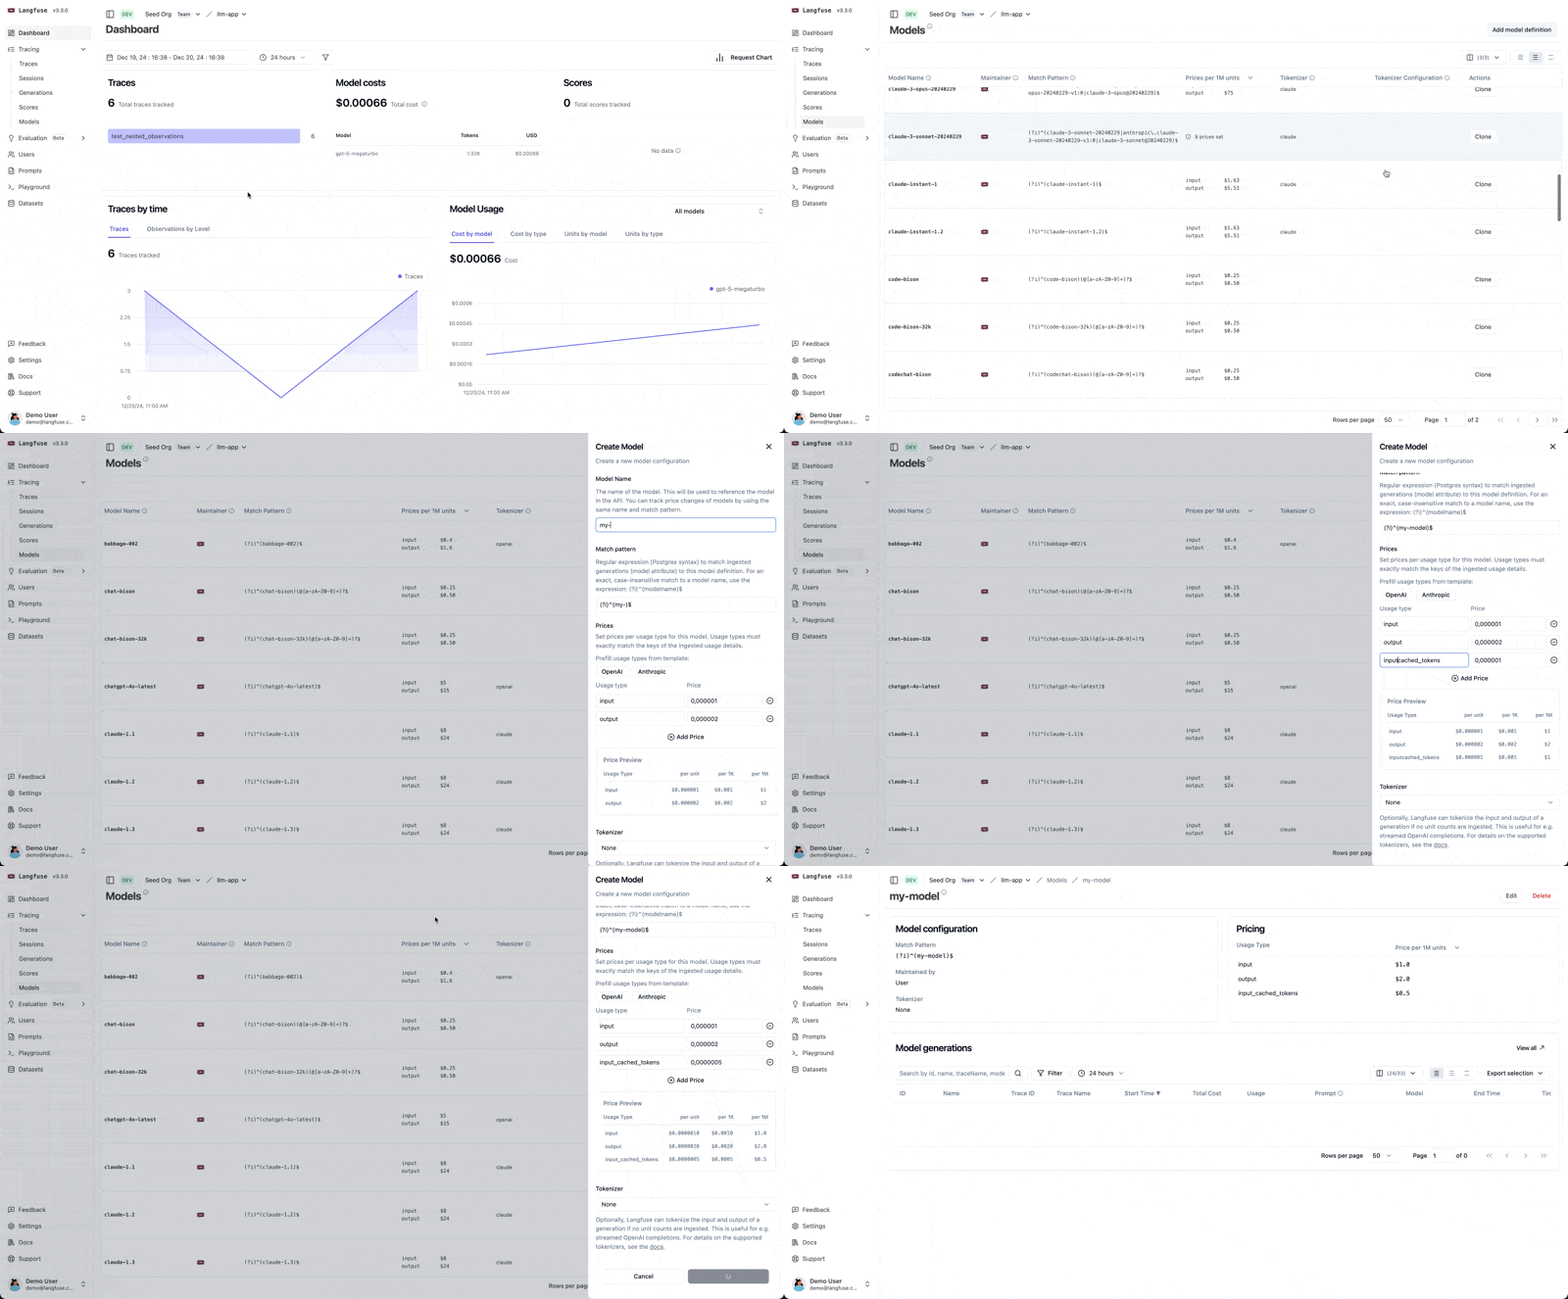
Langfuse is best suited to teams seeking an open-source LLM engineering platform with both self-hosted and managed-cloud options. It combines tracing, datasets, experiments, evaluation rules, scores, prompt management, and annotation workflows. Teams should compare the division between open-source and commercial features, the operational burden of self-hosting, and the maturity of agent-specific evaluation and automation workflows.
Instrumentation with Langfuse
Langfuse provides a native OTel instrumentation path, making it easy to bring tracing data into Langfuse. Its open-source SDK automatically converts emitted telemetry into observations, keeping your data portable while still unlocking LLM-specific tracing features.
Instrumentation is straightforward: initialize the Langfuse SDK, register Langfuse as a processor, and instrument your application with a function decorator.
# pip install langfuse

# .env config
LANGFUSE_SECRET_KEY="..."
LANGFUSE_PUBLIC_KEY="..."
LANGFUSE_HOST="https://cloud.langfuse.com"
Once your environment is configured, you can start tracing any function using the @observe decorator. It automatically captures inputs, outputs, and timings.
from langfuse import observe, get_client

@observe
def my_function():
    return "Hello, world!"  # Input/output and timings are automatically captured

my_function()

# Flush events in short-lived applications
langfuse = get_client()
langfuse.flush()
What Langfuse is good for
- Smaller teams with open source DNA: Teams that want an open-source observability stack with multi-modal trace support, cost tracking, and agent graphs out of the box.
- Infra-savvy teams: Teams that are good at managing their own infrastructure.
- Straightforward pipeline integration: OTel-compatible ingestion makes it straightforward to slot Langfuse into existing pipelines.
- Collaborative agent debugging: Debugging agent flows for when you need to inspect tool usage and annotate failure cases collaboratively.
Limitations of Langfuse
- Self-hosting overhead: Self-hosted deployments put infrastructure, upgrades, storage, and scaling responsibilities on your team.
- Enterprise feature boundaries: Some governance capabilities, including audit logging, require the Enterprise edition, so confirm which security and administration features are included in the tier you are evaluating.
- Evaluation operations: Langfuse supports annotation queues and online evaluation. Test reviewer workflow, evaluator management, monitoring, and alerting at the scale your team expects.
- Agentic workflows: Langfuse exposes evaluation workflows to agents through its CLI, MCP server, and agent tooling. Compare those workflows with more deeply integrated platform assistants if agent-driven debugging and evaluation automation are important to your team.
- Explore evaluation scores in Langfuse
- Run Langfuse experiments
W&B Weave: Best for existing weights & biases users
W&B Weave is an observability and evaluation platform within the Weights & Biases ecosystem. It combines tracing, datasets, scorers, evaluations, production monitors, guardrails, lineage, and model-development workflows.
What it’s best for
Teams already using Weights & Biases for model development or organizations that want to connect model, dataset, application, and agent evaluation in a broader AI development platform.
Strengths
- Agent-oriented traces: Weave represents sessions, turns, steps, tools, and subagents as application concepts.
- Flexible evaluation API: Evaluations combine datasets with custom, built-in, or third-party scorers.
- Production monitors: LLM judges can score sampled production operations and store results for trend analysis.
- Guardrails: Scorers can support active intervention for safety and quality checks.
- OpenTelemetry: Weave accepts OTLP traces and maps OpenTelemetry and OpenInference conventions into its data model.
- Lineage: W&B can connect evaluation results to datasets, code, models, prompts, and other development artifacts.
- Human feedback: Teams can define human-annotation scorers and attach feedback to traces.
- Deployment options: Weave supports multi-tenant cloud, dedicated cloud, and licensed self-managed deployments.
Tradeoffs to validate
- The platform is most compelling for organizations already invested in the W&B ecosystem.
- Self-managed Weave requires a licensed W&B installation and meaningful infrastructure ownership.
- Feature coverage differs across Python and TypeScript SDKs.
- Compare human-review queues, evaluator management, and agent-specific release workflows against products focused exclusively on LLM operations.
- Explore W&B Weave
- Set up production monitors in Weave
Comet Opik: Best Apache 2.0 platform for self-hosted agent evaluation
Opik is a platform from Comet for tracing, evaluation, prompt management, experiments, production monitoring, and agent optimization. It is Apache 2.0 licensed and available through Comet Cloud or as a self-hosted deployment.
Best for
Teams that want a self-hosted, agent-oriented platform with tracing, online and offline evaluation, prompt optimization, human review, and cloud deployment options.
Strengths
- Permissive license: Opik is Apache 2.0, the most permissive license among the self-hosted platforms in this comparison.
- Agent tracing: Opik records model calls, retrieval, tool invocations, agent steps, and conversation threads.
- Offline evaluation: Teams can use test suites, datasets, prebuilt metrics, custom metrics, and experiment comparison.
- Online evaluation: Rules can score production traces and threads, while on-demand evaluation can backfill historical data.
- Human review: Annotation queues provide focused review workflows for traces and threads.
- OpenTelemetry: Opik exposes an OTLP endpoint for cloud and self-hosted deployments.
- Prompt and tool optimization: Opik includes algorithms for optimizing prompts and tool definitions.
- Evaluator observability: Online LLM-as-a-Judge runs can be traced, including token usage and cost.
- Agent access: An MCP server connects coding agents to traces, scores, prompts, and experiment workflows.
Tradeoffs to validate
- Opik is newer than several platforms in this comparison. Validate enterprise support, governance, operational history, and migration requirements for your scale.
- The Python SDK currently provides broader feature coverage than the TypeScript SDK.
- Self-hosted production deployments require database, storage, monitoring, and infrastructure operations.
- Compare its agent evaluation, dashboards, and incident workflows against your exact failure modes and review processes.
- Explore Opik
- Explore Opik evaluation
Best LLM and agent evaluation frameworks and libraries
Some teams need an evaluation library rather than a complete platform. Libraries work well when evaluation should run locally, inside unit tests, through a CLI, or as part of an existing observability and data stack.
| Framework or library | Primary use | Best fit |
|---|---|---|
| Phoenix Evals | Model-agnostic LLM evaluators, code evaluators, batching, custom rubrics, and integration with traces and experiments | Teams that want an evaluation library that can run independently or connect to Phoenix and Arize AX |
| DeepEval | Pytest-style evaluation with metrics for RAG, agents, conversations, safety, tools, and custom criteria | Python teams that want evaluation to resemble software unit testing and run in CI/CD |
| Ragas | Metrics and test-data generation for RAG and agentic applications | Teams that need focused retrieval, grounding, tool-call, and agent-goal evaluation |
| Promptfoo | CLI- and configuration-driven prompt, model, application, and security evaluation | Teams that want evaluation-as-code, provider comparisons, red teaming, and CI/CD gates |
| lm-evaluation-harness | Standard benchmark evaluation of foundation and fine-tuned language models | Model builders and researchers comparing model capability on established benchmark tasks |
Model-benchmark frameworks and application-evaluation platforms solve different problems. A benchmark can help compare base models, while an application platform measures whether your complete RAG application, assistant, or agent succeeds with your prompts, data, tools, and users. See benchmark versus production evaluation for why benchmark scores rarely predict production behavior.
How to choose the right LLM and agent evaluation platform
1. Define the job the platform must support
- Are you evaluating a prompt, RAG pipeline, chatbot, voice application, or multi-step agent?
- Do evaluations need to run before deployment, after deployment, or both?
- Which engineers, product managers, subject-matter experts, or operations teams need to use the system?
- Which actions should follow a failed evaluation?
- Which data, security, and retention requirements apply?
2. Build a representative evaluation dataset
Use real examples whenever possible. A useful proof-of-concept dataset should contain:
- Common successful requests
- Known production failures
- Ambiguous or underspecified inputs
- Malformed tool arguments
- Retrieval misses and irrelevant context
- API errors and timeouts
- Policy-sensitive cases
- Tasks that should escalate to a person
- Long or multi-turn interactions
3. Define a small set of trusted evaluators
Start with task success and add diagnostic metrics that point toward a fix.
| Metric | What it tells you |
|---|---|
| Task success | Whether the application completed the user’s intended job |
| Output quality | Whether the result was correct, relevant, complete, grounded, or useful |
| Retrieval quality | Whether the application retrieved relevant, sufficient, and accurate context |
| Tool selection | Whether an agent selected the correct tool or correctly avoided tool use |
| Tool-argument correctness | Whether the selected tool received valid and complete parameters |
| Trajectory quality | Whether required steps occurred and repeated, unnecessary, or prohibited actions were avoided |
| Recovery rate | Whether the application recovers correctly from tool errors, invalid responses, or interruptions |
| P95 latency | How slowly the worst meaningful group of requests completes |
| Cost per successful task | How much useful completed work costs across model calls, tools, retries, evaluation, and review |
| Human intervention rate | How much approval, correction, or escalation the workflow requires |
Our LLM evaluation metrics guide covers how to define and instrument these measures in more detail.
4. Calibrate evaluators against human labels
Have domain experts label a representative subset. Run each automated evaluator on the same examples and inspect disagreements.
Review false positives and false negatives separately, particularly when a score can block a release, trigger an alert, or route a customer interaction to a person.
5. Compare platforms under the same conditions
Hold the application, model, prompts, dataset, evaluators, and sampling settings constant where possible.
You should look to compare the following across solutions:
- Instrumentation effort
- Trace completeness
- Evaluator authoring and debugging
- Experiment reproducibility
- Human-review throughput
- Production sampling and filtering
- Dashboard and alert usefulness
- Data export and API access
- Deployment and security effort
- Total cost at expected volume and retention
6. Test one complete improvement loop
Do not end the proof of concept after generating a score. Complete the workflow:
- Trace an application run.
- Detect a failure with an evaluator.
- Route the example for human review.
- Add the validated failure to a dataset.
- Change the prompt, model, retrieval strategy, tool, or agent harness.
- Run an experiment against the dataset.
- Compare the candidate with the current production version.
- Apply a release threshold.
- Deploy the change.
- Run the evaluator against new production traffic.
The platform that handles this loop reliably will usually be more valuable than the platform with the longest feature checklist.
Agent evaluation platform FAQ
What is the best agent evaluation platform?
There is no universal winner. Arize AX is designed for managed enterprise evaluation and observability across development and production. Phoenix, Langfuse, and Opik provide self-hosted options. LangSmith fits naturally with LangChain and LangGraph. Braintrust emphasizes eval-driven experimentation. W&B Weave connects application evaluation to a broader model-development platform. Test shortlisted products on your own data and workflows.
What is the top AI evals platform?
The top AI evals platform for production teams combines offline datasets and experiments with online evaluation on live traces. Shortlist platforms that support your deployment model (managed or self-hosted), the evaluation granularity you need (span, trace, trajectory, or session), and CI/CD integration. Compare candidates in the table above using your own application data.
What is the top eval platform?
The top eval platform is the one your team will actually run on every meaningful change—not the one with the most demo-friendly UI. Prioritize reproducible experiments, evaluator versioning, human review for ground truth, and production monitoring with alerts. Agent applications should also support trajectory and tool-call evaluation.
What is the best AI evaluation platform?
The best AI evaluation platform depends on whether you need enterprise governance, open-source self-hosting, or deep integration with a specific agent framework. For many teams, the decision comes down to how well the platform connects pre-deployment experiments to post-deployment failure analysis. Start with the comparison table, then run a proof of concept on one real workflow.
What is the difference between an LLM evaluation platform and an evaluation framework?
An evaluation framework or library provides code for running metrics, tests, or benchmarks. An evaluation platform adds shared traces, datasets, experiments, human review, monitoring, collaboration, access controls, and production workflows. Teams often use an evaluation library inside a broader platform.
What is the best self-hosted agent evaluation platform?
Phoenix, Langfuse, and Opik are prominent self-hosted options with different licenses, architectures, and enterprise extensions. Opik is Apache 2.0, the Langfuse core is MIT with separately licensed enterprise directories, and Phoenix is Elastic License 2.0. LangSmith offers hybrid and self-hosted enterprise options. Braintrust offers BYOC and a self-hosted data plane, while its control plane remains Braintrust-managed SaaS. These commercial deployment models differ from fully open-source self-hosting. Compare instrumentation, production evaluation, human review, infrastructure requirements, security controls, and license terms before choosing.
Which platform is best for AI agent evaluation?
Choose a platform that captures complete agent traces and can evaluate final outcomes, tools, arguments, observable trajectories, sessions, cost, and recovery behavior. The decisive factor is how well each platform represents and evaluates your agent’s actual control flow.
Which evaluation platform is best for LangChain or LangGraph?
LangSmith provides the tightest native integration with LangChain and LangGraph. OpenTelemetry-compatible alternatives such as Arize AX, Phoenix, Braintrust, Langfuse, W&B Weave, and Opik can also trace and evaluate LangChain or LangGraph applications while keeping the observability layer separate from the orchestration framework.
Do I need OpenTelemetry for LLM evaluation?
No. OpenTelemetry can, however, reduce instrumentation lock-in and connect AI traces with the rest of an application’s distributed telemetry. OpenInference adds conventions for model calls, retrieval, tools, agents, guardrails, and evaluators.
Can I use an evaluation framework with a different observability platform?
Yes. Evaluators from Phoenix Evals, Ragas, DeepEval, Promptfoo, custom code, or internal services can often run independently and send their results to another platform. Confirm how inputs, scores, explanations, evaluator versions, and trace identifiers will be exchanged.
How should I evaluate an LLM evaluation platform?
Run the same representative dataset, application version, and evaluators through each shortlisted platform. Test offline experiments, production scoring, human review, evaluator debugging, data export, deployment, and one complete trace-to-fix workflow. Compare task success and operational effort rather than relying only on feature availability.

