

Overview
You will build a small issue-triage agent. It reads a project’s open issues through a customlist_issues tool that your application runs, counts them by label with bash in its sandbox, and names the most urgent one. You trace a session from end to end and read the trace in Phoenix. Then you add an evaluator that checks whether the agent picked the right issue.
This guide is for developers who build agents on Claude Managed Agents and want to observe and evaluate them in Phoenix. You should be comfortable with:
- Python, TypeScript, Go, or Java
- The Managed Agents concepts of agents, environments, sessions, and events. The Managed Agents quickstart covers them.
- Reading traces in Phoenix
- Send the spans that the Claude Platform creates to a Phoenix project
- Join those spans with your application’s spans into one trace
- Trace the custom tools that your application runs for the agent
- Evaluate the agent’s answers with an LLM-as-a-judge task
Before you start
You need:- Python 3.10+, Node.js 18.19+, Go 1.26+, or Java 17+
- A running Phoenix instance with an OTLP/HTTP endpoint that Claude Platform can reach. If your instance requires authentication, create a Phoenix API key.
- The admin role in a Claude Console organization, to add a destination
- An
ANTHROPIC_API_KEYfrom the Claude Console
localhost can receive your application’s SDK spans, but it will not receive the Console-exported API spans unless you expose it with a public HTTPS tunnel or use Phoenix Cloud.
Step 1: Send Claude Platform spans to Phoenix
The Claude API exports its spans to destinations that you add in the Claude Console. Add an Arize Phoenix destination that points at the Phoenix project for this guide:
Claude Console destination configured to export Claude Platform spans to Phoenix
- In the Claude Console, open the OpenTelemetry settings page and click Add destination.
- Set Provider to Arize.
- Set Product to Arize Phoenix.
- Set Phoenix URL to your Phoenix base URL, such as
https://phoenix.example.com. Do not include/v1/traces; Claude Platform appends the per-signal path automatically. - Set API key to a Phoenix API key for Phoenix Cloud or an authenticated self-hosted instance.
- Set Project name to
claude-managed-agents-triage. The Console sends this as the destination’sx-project-nameheader. - Set Content mode to Full content. The default, Metadata only, leaves out the prompts, messages, and tool arguments that this guide reads and evaluates.
- Set Workspaces to the workspaces whose spans you want in Phoenix. Use Selected and choose the workspace for your
ANTHROPIC_API_KEYif you want only this guide’s traffic. Then click Add destination. - In the destination’s More actions menu, click Test. In Phoenix, check that an
anthropic.testspan arrived in theclaude-managed-agents-triageproject.

The destination's More actions menu in the Claude Console, with Test highlighted
Step 2: Set up tracing in your application
Your application needs an OpenTelemetry tracer provider that exports to the same Phoenix project. The Claude SDK uses the tracer provider that your application registers, so you don’t pass it to the client. Install the Claude SDK and the tracing packages for your language:PHOENIX_PROJECT_NAME must match the destination’s Project name from Step 1, so the two sources of spans meet in one project:
ANTHROPIC_OPEN_TELEMETRY_TRACES_CONTENT_MODE=content makes the SDK’s spans carry prompts and responses, matching the Full content mode of the destination.
For Python and TypeScript, register the tracer provider in its own module, so that it runs before the Claude SDK makes its first request:
main in the next step. It also registers the W3C trace context propagator, which neither language registers by default. The SDK uses the propagator to send each span’s trace context to the Claude API, which then nests its own spans under yours.
Step 3: Build the triage agent
The program has three functions. The names below are the Python ones, and the other languages use their own casing, such ascreateAgent in TypeScript:
create_agentcreates an environment and an agent. The agent has Anthropic’s built-in toolset, with the web tools turned off, and one custom tool,list_issues. A custom tool runs in your application, not in the sandbox. That makes it the right place for anything that needs your data or your credentials.list_issuesanswers the custom tool from a small list of sample issues. It wraps that work in its ownTOOLspan, with OpenInference’s@tracer.tooldecorator in Python and itstraceToolwrapper in TypeScript. In Python,@tracer.toolreads the tool’s name, description, and parameters from the function’s name, docstring, and signature. TypeScript, Go, and Java set them on the span themselves. The Claude API sees the call and the result but not your code, so this span is the only record of what your application did. If you run custom tools with the Claude SDK’s session tool runner instead, the SDK creates thisTOOLspan for you, so don’t add your own.run_triagestarts a session inside atriage-requestCHAINspan, created with@tracer.chainin Python andtraceChainin TypeScript, sends the request, and reads the session’s event stream. When the agent callslist_issues, the session pauses until your application sends back the result. The loop ends when the session goes idle for any reason other thanrequires_action, which means it’s waiting on you.
triage-request span records the request as its input and the agent’s answer as its output. The Python and TypeScript helpers record them from the function’s argument and return value, and Go and Java set the input.value and output.value attributes themselves. The evaluator in Step 6 scores those two values. Every span you create also sets its status: OK on success, or an error with the exception if a request fails.
Agents and environments are persistent and versioned. The program creates them on each run to stay self-contained. In your own application, create them once, store their IDs, and pass the IDs to each
sessions.create call.Step 4: Run a session
Run the program:list_issues, counts the issues by label with bash in its sandbox, and replies. The wording and layout vary from run to run, but the output looks similar to this:
Step 5: Explore the trace
Open your Phoenix instance and select theclaude-managed-agents-triage project. A new trace appears within about a minute. The API’s spans can arrive after yours. Open the trace to see the session from both sides:

A Claude Managed Agents trace in Phoenix, with your application span joined to the spans exported by Claude Platform
triage-requestis your root span, with the request as input and the agent’s answer as output.- Under it are the SDK’s
CLIENTspans, one for each request your application sent. Each one contains the API’s span for the same request, with the same name. - Under the request that sent your message is the agent’s first turn. It ends with the stop reason
requires_actionwhen the agent callslist_issues. Yourlist_issuesTOOLspan follows, then the request that sent the result, and a second turn in which the agent runs bash and answers. - The SDK’s spans for creating the environment and the agent are in traces of their own, because the program creates them before it starts
triage-request.
list_issues span to inspect your application’s tool input and output:

A custom list_issues tool span showing the request and returned issue data
anthropic.session.turn span to read the turn’s message attributes, including user messages, tool calls, and tool results. Phoenix shows these values on the Attributes tab as llm.input_messages.*, gen_ai.input.messages, and gen_ai.output.messages:

A session turn span in Phoenix with the Claude Platform message attributes
anthropic.model_request span to see the model and the token usage of one model request. Open the bash tool span to see the command that the agent ran in its sandbox. Its arguments are the span’s input:
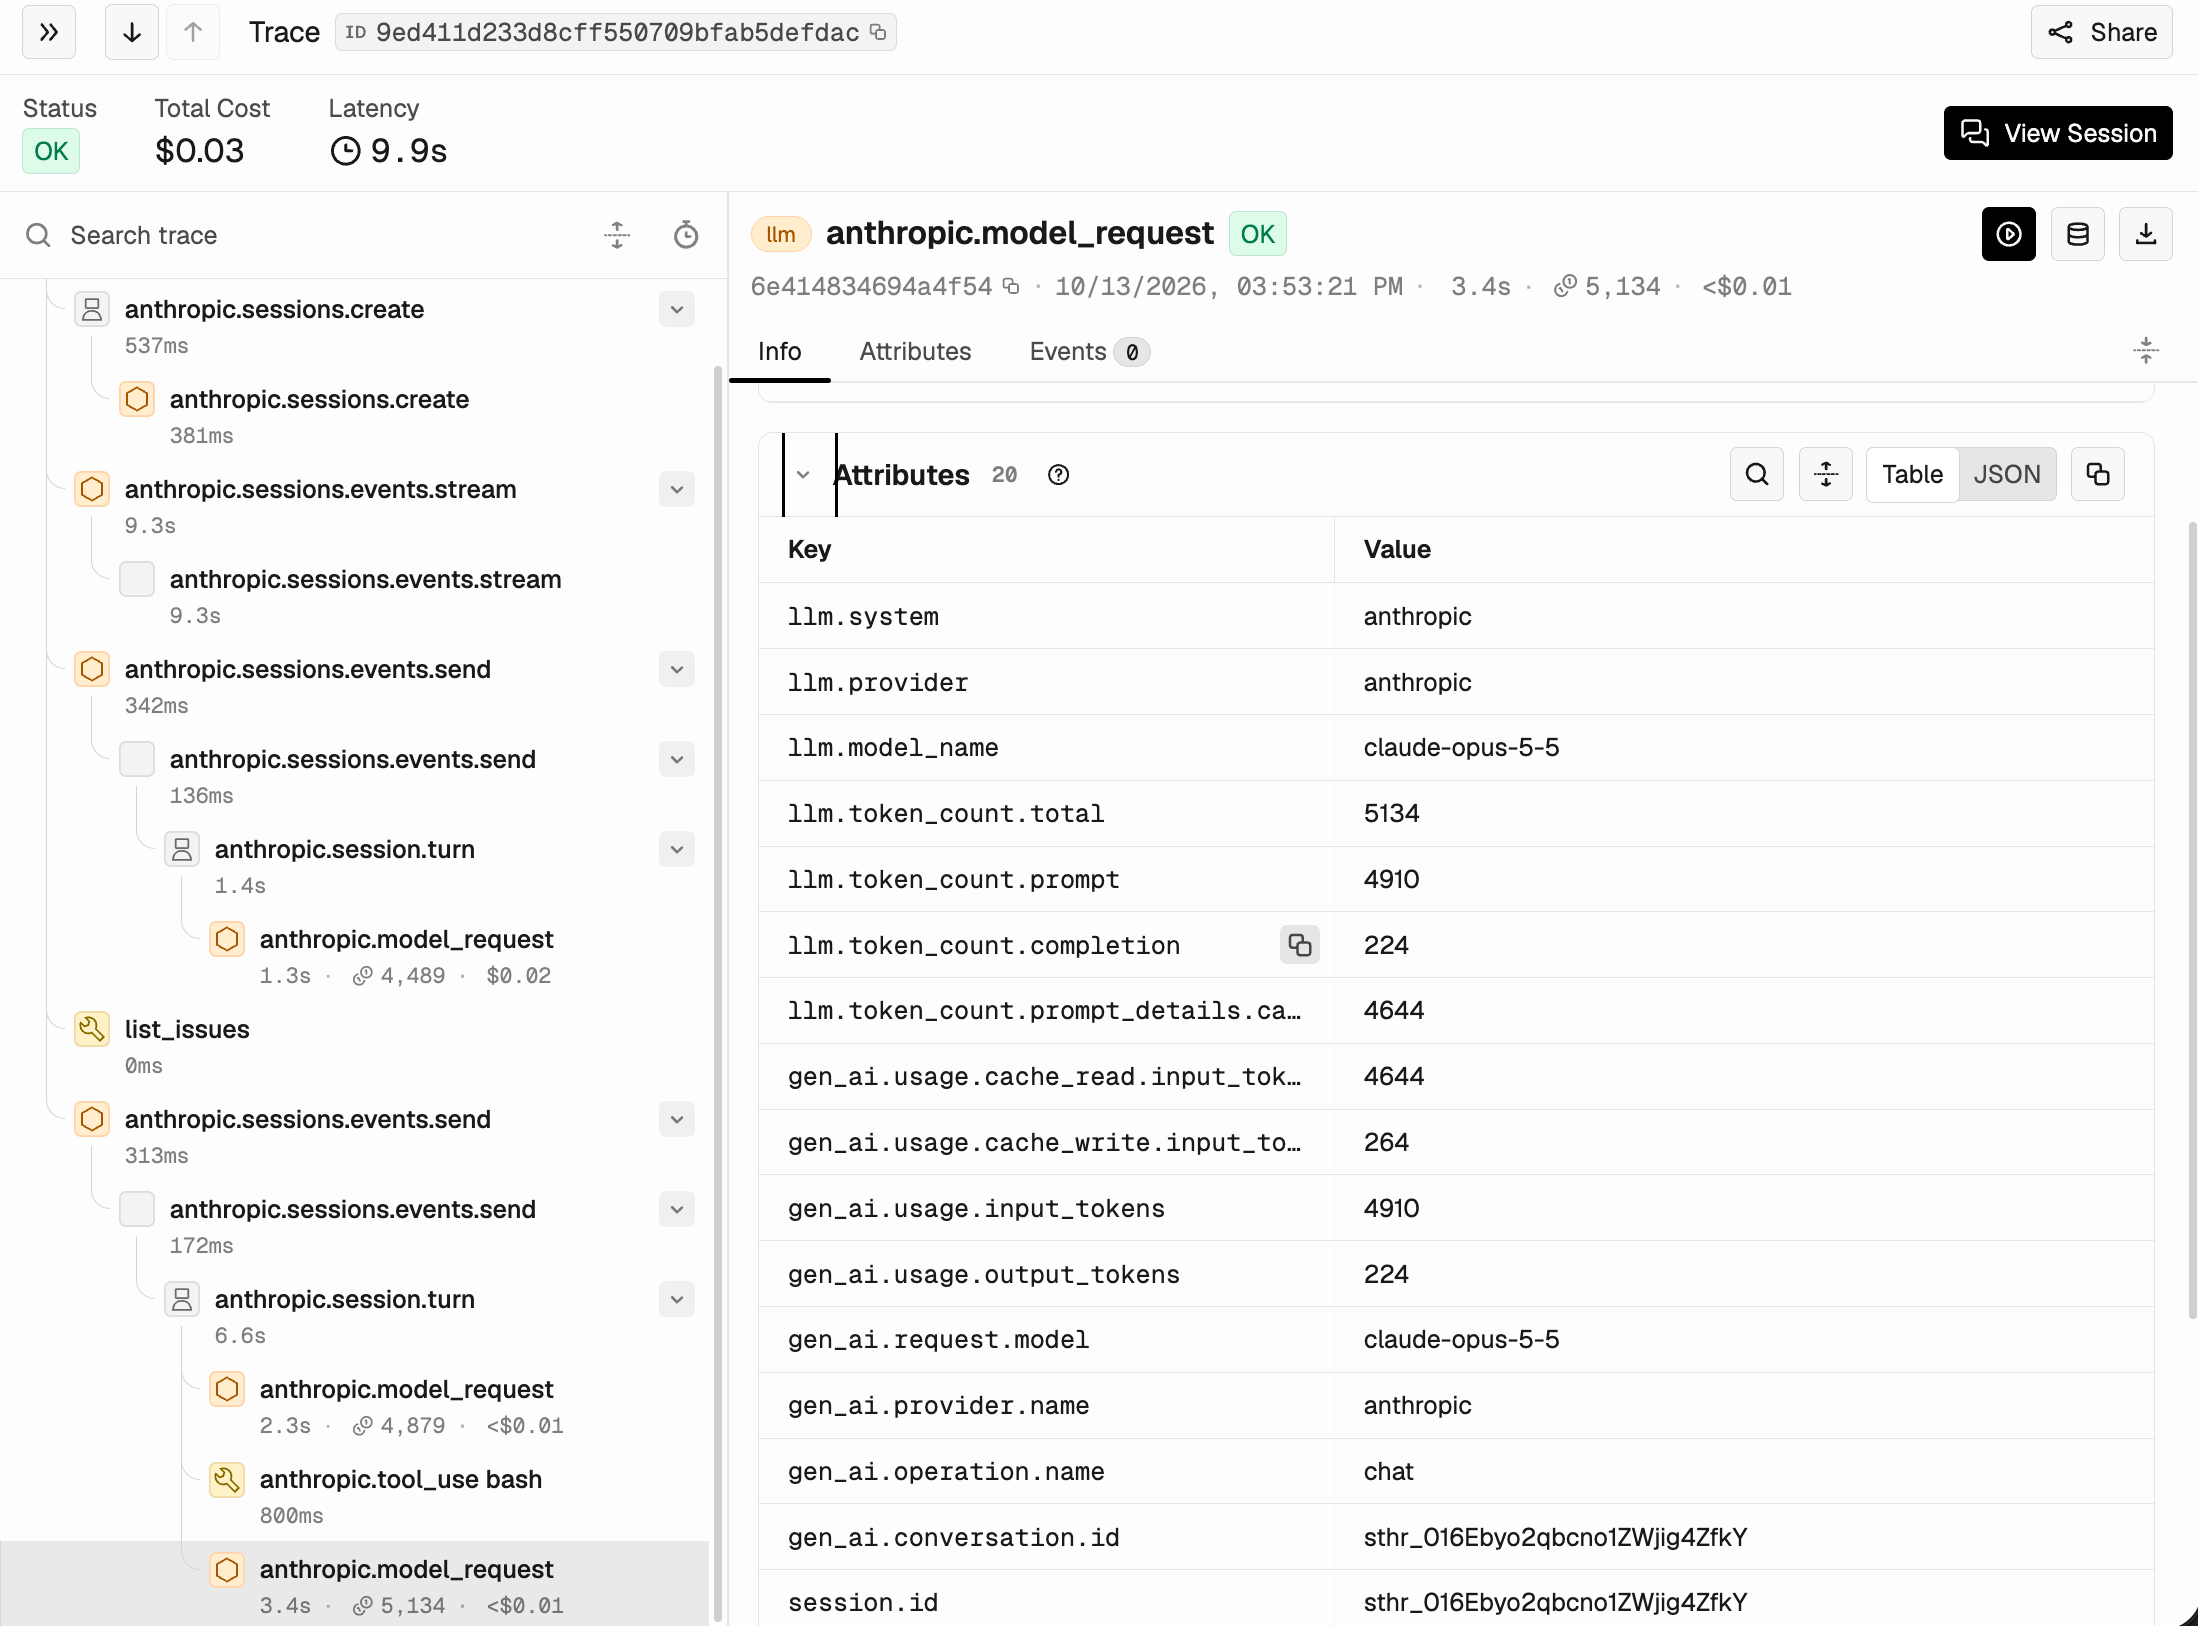
A model request span showing model name, token usage, latency, and cost

A bash tool call span showing the command that ran in the Claude Managed Agents sandbox
anthropic.tool_result.content attribute, on the Attributes tab.
The API’s spans also carry the session thread ID in gen_ai.conversation.id, which Phoenix uses as the session ID. Open Sessions in the project and select the session to read the thread as a conversation. The Sessions list itself shows no first message, last message, or duration for these sessions, because the session ID is only on the SDK’s and the API’s spans further down the trace. For a session with several threads, filter spans on anthropic.session.id. A turn that starts because an agent on another thread replied or finished has no parent, so it’s the root of a trace of its own.
Step 6: Evaluate the triage
The trace shows what the agent did. An evaluator tells you whether it did it well. Sample issue #101 locks out a whole region, so a good triage names it as the most urgent. Create an LLM-as-a-judge evaluator that checks the agent’s answer against that:- In Phoenix, open Evaluators and click New Task.
-
Name the task
triage-qualityand select theclaude-managed-agents-triageproject. -
Add a filter on the span name
triage-request, so the task scores your root spans. -
Click Add Evaluator, choose Create Custom, and use this template:
-
Map
inputtoattributes.input.valueandoutputtoattributes.output.value, and set the choices tocorrect(score 1) andincorrect(score 0). - Turn on Run continuously, and run it once on your existing traces as well.
- Click Create Task.
triage-request span gets a triage-quality label.
Filter the project on incorrect to find the sessions where the agent got it wrong, and open their traces to see whether the cause was the tool result, the bash step, or the model’s reasoning. For programmatic evaluation workflows, see Evaluating Phoenix traces.
Step 7: Read token usage correctly
In a Managed Agents session, only theanthropic.model_request spans, and the anthropic.session.outcome_evaluation spans when you use outcomes, carry token usage. The turn spans and the Sessions API request spans don’t, so the trace’s token total is the session’s total.
Two details affect what you read:
- Cache reads are part of the input tokens. The agent’s system prompt and tools are cached after the first model request, so most of each request’s input tokens are cache reads, billed at a lower rate. The spans report them in
gen_ai.usage.cache_read.input_tokensandgen_ai.usage.cache_write.input_tokens, which Phoenix doesn’t map yet, so it counts them as regular prompt tokens and its cost estimate can be higher than what you were billed. - The
anthropic.sessions.createspans show asLLMspans with zero tokens. They carry the agent’s model, but they aren’t model calls, so leave them out when you count model requests.
Summary
You traced a Claude Managed Agents session from both sides and evaluated its result:- A Claude Console destination sends the spans that the Claude API creates to a Phoenix project, routed by the destination’s project name.
- The Claude SDK’s spans and W3C trace context join those spans to your application’s own trace.
- A manual
TOOLspan records the custom tool that your application runs, which the Claude API can’t see. - An LLM-as-a-judge task scores each triage, so you can find the runs that went wrong and trace their cause.
Next steps
Claude Managed Agents integration
The reference for the Console destination, the SDK setup, and the spans Phoenix captures.
Session-level evaluations
Score whole conversations instead of single answers.
Evaluate agents
Score tool selection, tool results, and goal completion.
GenAI semantic conventions
How OpenInference and OpenTelemetry GenAI semantic conventions compare.