

Agent observability: how to trace, debug, and improve AI agents
Chapter summary
This post is authored by Aryan Kargwal, PhD at PolyMTL.
Last updated on October 7, 2026.
TL;DR
Agent observability gives you an inspectable record of how an AI agent reached an outcome, not just the final response. It connects model calls, retrieved context, tool activity, handoffs, and state changes across traces and sessions so you can find where execution diverged.
To implement agent observability:
- Define what successful task completion looks like and verify it in the system where the action occurred.
- Use automatic instrumentation for supported models and frameworks, then add manual spans around custom tools, retrieval, application logic, and state changes.
- Preserve trace and session context so related operations remain connected across services, turns, and subagents.
- Use evaluations to judge the quality of individual spans, traces, or sessions, and monitors to detect production changes that require action.
- Start with one metric that proves the agent completed its job, then add diagnostic signals such as tool failures, retries, handoff errors, latency, and cost per successful task.
The goal is not to collect every available signal. Capture enough evidence to explain failures, verify that changes improved the workflow, and decide where the agent is ready for greater autonomy.
Introduction
Your agent returns the right answer, so the run looks successful. A closer look may reveal repeated tool calls, stale context, failed handoffs, or an action that never reached the downstream system. The final response hides the path that produced it.
Agent evaluation tells you whether the outcome and trajectory met your criteria. Diagnosing the result requires the execution data behind that judgment: model calls, tool inputs and outputs, retrieved context, state changes, and session history.
Agent observability collects and connects that data across the full run. It organizes individual operations into traces and sessions, giving you a continuous view from the initial request through the final outcome.
With that view, you can locate where execution diverged and determine which part of the workflow needs to change. This chapter of the AI agent handbook explains what to capture, how to instrument an agent, which production signals matter, and how Arize connects observed failures to evaluation and improvement.
What is agent observability?
Agent observability is the practice of capturing and connecting an AI agent’s activity so you can understand how it reached an outcome. It gives you one inspectable record of the complete run, with related events kept in their execution order.
The record begins with the user request and follows the agent through model calls, retrieved context, tool activity, state changes, and handoffs. Traces preserve the order and context of those operations, showing how the run developed before the final result.
When the agent behaves unexpectedly, you can follow the same record back to the point where execution diverged. This makes failures easier to reproduce and gives monitoring and evaluation workflows the context they need to assess real agent behavior.
Together, these records create a continuous view of the agent’s behavior across a run and across related sessions.
This chapter covers the practice. For the tooling category, including what an agent observability platform does and how it differs from APM and model monitoring, see the platform guide.
Build better agents with Arize
Trace, evaluate, and learn. Build agents that work with Arize AX and start tracing your runs today.
Prefer open source? Try Arize Phoenix for self-hosted, open source agent observability.

Why agent observability matters
A continuous execution history becomes operationally important once an agent enters a workflow that people depend on. It helps your team respond to failures and decide when the agent is ready for greater responsibility.
- Faster incident resolution. When an agent fails, engineers can work from a shared account of the run. This reduces time spent reconstructing events and helps the team assign the problem to the correct part of the system.
- More predictable operating costs. Opaque execution makes rising costs difficult to explain. Observability helps teams find inefficient behavior before it becomes accepted in production or makes the application too expensive to scale.
- Safer expansion of agent autonomy. Reviewable execution gives teams a stronger basis for setting boundaries and deciding where human intervention remains necessary. The launch-readiness and risk case for agent evals covers how teams turn that evidence into approval boundaries.
- Evidence that improvements hold. Observability lets teams compare behavior over time and verify that a change improved the workflow under real production conditions.
Keller Williams encountered this problem while developing a multi-step text-to-SQL agent. The workflow searched for relevant tables, consulted a library of known-good queries, and then wrote and executed SQL. On the surface, the agent appeared successful: it returned a query that matched what the team wanted and delivered the requested data.
The traces told a different story. By inspecting the spans, the team found that the agent was calling tools in the wrong order and making unnecessary calls. Those inefficiencies were invisible in the final result but could have produced significantly higher costs as usage increased. The example shows why observing the execution path matters even when an agent completes the task.
Agent observability turns uncertain behavior into a manageable engineering problem. It provides the operational confidence needed to maintain the agent and expand its responsibilities carefully.
What should you observe in an AI agent?
To understand an agent run, observe the outcome it produced, the path it followed, the actions it attempted, and the context that informed its decisions. These are the core observation surfaces, not an exhaustive checklist.
Each surface can branch into application-specific metrics based on the agent’s task, users, operating environment, and known failure modes. Keep the surfaces connected within the same execution record because a failure in one can affect every step that follows.
Did the agent complete the task?
Task completion should be observed at the boundary where the requested work becomes real. The agent’s final response records what it believes happened, while confirmation from the target system establishes whether the intended outcome was reached.
The required confirmation depends on the task. A support workflow may end when the ticket state changes, while a coding workflow may require a passing test and a saved artifact. Agent observability should connect that confirmation to the trace so you can see which actions produced the outcome and where an incomplete run stopped.
Once task completion is observable per run, it can be aggregated into the business measures your organization already tracks. The agent analytics buyer’s guide covers how completion, adoption, and support outcomes roll up for non-engineering stakeholders.
Did the agent follow an acceptable path?
Raw step count is a weak measure of path quality. An agent may need to explore, retry after a tool failure, or change direction when new evidence appears. The observable question is whether those steps changed the state of the task.
A productive step adds information, completes part of the workflow, resolves a constraint, or narrows the agent’s next decision. Repeated calls that return the same evidence, routing cycles, unnecessary corrections, and handoffs that lose context add motion without meaningful progress.
The trace should preserve the sequence and state transition around each action. A research agent, for example, may need several retrieval calls before it has enough evidence to answer. Repeated retrieval becomes a problem when new calls stop changing the information available or the decisions that follow.
Several trajectories may be acceptable for the same task. Agent observability should give you enough evidence to explain why the agent chose its path, where it recovered, which boundaries it respected, and whether each detour served the task.
Were the agent’s tool calls correct?
A tool call should be observed in relation to the agent’s intent. You need to see what the agent was trying to accomplish, why it selected a particular tool, which arguments it supplied, and how it interpreted the result.
Suppose a customer asks an agent to cancel an upcoming payment. The agent recognizes that a payment must be stopped, but uses a refund_payment tool with the ID of an earlier transaction stored in the session. The tool returns a successful response, yet the upcoming payment remains scheduled and the wrong transaction is refunded.
The intended action was to prevent the next payment. A correct execution would retrieve the active payment schedule, call cancel_scheduled_payment with the current schedule ID, and verify that its status changed to canceled before confirming completion to the customer.
The trace should connect the request, the agent’s reasoning, the selected tool, its arguments, the returned result, and the resulting state. This reveals whether the agent chose the wrong tool, acted on stale information, or treated a technically successful response as proof that the task was complete.
Did the agent use the right context and state?
An agent acts on more than its inherent knowledge. Observe which websites, files, memories, instructions, and session state were available, whether each source was permitted, and which information actually informed the run.
Persistent context can also compound errors. An agent may save an unsupported assumption to memory, create or modify an AGENTS.md file unnecessarily, and continue feeding that incorrect context into later runs. The trace should show when state was read or changed so you can identify where unreliable context entered the workflow.
How to implement agent observability
Implementing agent observability starts with deciding which parts of an agent run must be explainable, then instrumenting the application so those events can be reconstructed as a trace and followed across a session.
Capture enough context to connect an outcome with the model calls, retrieval steps, tool activity, handoffs, and state changes that produced it. Evaluations and monitors can then turn that execution data into signals your team can investigate and use to improve the wider agent harness.
For the examples below, we use Arize AX as the trace backend. The same OpenTelemetry and OpenInference instrumentation can send traces to Arize Phoenix, which is convenient for local development, self-hosted deployments, and smaller experiments.
1. Define observable outcomes and actions
Before adding instrumentation, define what successful completion looks like for the task. Identify the actions that can affect the outcome and the evidence required to confirm that each action succeeded.
For example, a customer service agent may report that it created a return. That statement does not confirm that the commerce system accepted the request. The trace should record the order identifier, the eligibility result, the submitted request, and the status returned by the commerce system.
2. Combine automatic and manual instrumentation
Most agents require both automatic and manual instrumentation. Use OpenInference integrations to capture supported model providers and agent frameworks. Add manual spans around custom tools, retrieval functions, and application logic that the integration cannot see.
Both approaches produce OpenTelemetry spans, so automatic and custom operations can remain connected within the same trace. Arize documents the ordering and tracer-provider rules for combining automatic and manual instrumentation, and span design for agent tracing and evaluation covers how to structure spans so they support evaluation later.
The following example uses automatic instrumentation for OpenAI calls and manual spans for the agent and its custom retriever.
import json

from arize.otel import register
from openai import OpenAI
from openinference.instrumentation.openai import OpenAIInstrumentor

tracer_provider = register(
space_id="YOUR_SPACE_ID",
api_key="YOUR_API_KEY",
project_name="support-agent",
)

OpenAIInstrumentor().instrument(tracer_provider=tracer_provider)

tracer = tracer_provider.get_tracer(__name__)
client = OpenAI()

def retrieve_documents(query: str):
with tracer.start_as_current_span("retrieve-documents") as span:
span.set_attribute("openinference.span.kind", "RETRIEVER")
span.set_attribute("input.value", query)

documents = vector_store.search(query)

for index, document in enumerate(documents):
prefix = f"retrieval.documents.{index}.document"
span.set_attribute(f"{prefix}.id", document.id)
span.set_attribute(f"{prefix}.score", document.score)
span.set_attribute(f"{prefix}.content", document.text)

span.set_attribute(
"output.value",
json.dumps([{"id": d.id, "score": d.score} for d in documents]),
)
span.set_attribute("output.mime_type", "application/json")

return documents

def run_agent(question: str):
with tracer.start_as_current_span("support-agent") as span:
span.set_attribute("openinference.span.kind", "AGENT")
span.set_attribute("input.value", question)

documents = retrieve_documents(question)
context = "\n".join(document.text for document in documents)

completion = client.chat.completions.create(
model="gpt-5.5",
messages=[
{
"role": "user",
"content": f"Use this context:\n{context}\n\n{question}",
}
],
)

answer = completion.choices[0].message.content or ""
span.set_attribute("output.value", answer)

return answer
register() also reads ARIZE_SPACE_ID, ARIZE_API_KEY, and ARIZE_PROJECT_NAME from the environment if you prefer not to pass them in code.
One run now produces a parent AGENT span, a manually created RETRIEVER span, and an automatically created LLM span. The trace preserves how retrieved information moved into the model call and contributed to the answer. Because the retriever span sets the indexed retrieval.documents attributes, each returned document is also available individually for relevance evaluation.
3. Capture model calls, retrieval, tools, and state
Creating spans is only the first step. Each span must preserve enough information to explain the operation it represents.
- Model calls: Record the model, messages, response, invocation parameters, token usage, and latency. Arize’s trace customization controls can also attach the prompt template version or application release that produced the call.
- Retrieval: Preserve the query and enough information to identify the returned documents. The OpenInference document attributes support document identifiers, content, metadata, and relevance scores.
- Tool execution: Capture the tool definition, submitted arguments, returned result, and any exception. If the tool changes an external system, record the resulting identifier or status so the trace can confirm what happened outside the agent.
- Context and state: Record the memory source, instruction set, or state version used during the run. Apply a shared session.id when the agent carries context across multiple turns or traces.
Prompts, documents, tool arguments, and stored memory may contain private information. Apply masking and redaction before the trace leaves the application.
4. Connect spans across traces and sessions
Individual spans become useful when their relationships are preserved. Propagate trace context so model calls, retrieval, tool execution, and agent handoffs remain attached to the operation that triggered them. Arize’s tracing model uses these parent-child relationships to reconstruct the complete run.
Custom agents may also need metadata that identifies logical nodes and handoffs. Arize AX uses graph.node.id and graph.node.parent_id to represent those relationships in its agent trajectory views. Frameworks such as LangGraph, AutoGen, CrewAI, Agno, and the OpenAI Agents SDK set these attributes through their auto-instrumentors, so no additional work is required.
A longer interaction may produce several traces. Apply the same session.id to related turns or runs so you can follow changes in context, state, and behavior over time. The session groups related traces, while each trace preserves the execution of a particular run.
If work moves into a background process, remote service, or subagent, pass the trace context with it using OpenTelemetry context propagation. Otherwise, the operation may appear as an unrelated trace and break the execution record.
5. Add evaluation and production monitoring
Evaluations and monitors serve different purposes. Evaluations score behavior within spans, traces, or sessions. Monitors watch production metrics over time and alert when they cross a defined threshold. The LLM evaluation hub covers method selection in more depth.
- Ground evaluations in reviewed traces. Inspect real runs, identify recurring failure patterns, and use human annotations to establish examples of acceptable and unacceptable behavior.
- Match the scope and method to the behavior. Evaluate a span for one operation, a trace for the complete execution path, or a session for behavior across several turns. Use code for deterministic checks and an LLM evaluator when the criterion requires judgment.
- Configure how the evaluation runs. An Arize AX evaluation task defines the data source, input mappings, evaluation scope, cadence, filters, and sampling rate. Start with a historical backfill before applying the evaluator continuously to new traces as online LLM evaluations.
- Budget for the evaluation itself. Cadence, sampling rate, and judge model all affect spend, and what LLM evaluation costs walks through the cost model before you scale a continuous task.
- Review the results before relying on them. Inspect evaluation labels, scores, explanations, and task logs. Compare disputed results with human annotations and refine the evaluator when it produces false positives or misses known failures.
- Create monitors for actionable production metrics. An Arize AX monitor can watch a span attribute or custom metric related to quality, latency, errors, token usage, or cost. Configure the time window, check frequency, threshold, and notification destination according to how quickly the team needs to respond.
Use monitoring for changes that require operational action. Less urgent signals can remain visible in dashboards for investigation without generating an alert.
6. Use production failures to guide improvement
A failure should not remain buried in an individual trace. Dashboards provide the reporting layer, showing whether the behavior is isolated or part of a broader change in task success, evaluation scores, errors, latency, token use, or cost.
Suppose task success falls after a new agent version is released. The team can identify the change in an Arize AX dashboard and open the traces behind the affected period. If the decline crosses an actionable threshold, a monitor can send an alert through the Slack integration. The alert should include the affected metric and time window, along with a direct route back to the relevant evidence.
From there, an engineer can investigate in AX or bring the evidence into a coding agent. Arize Skills and the AX CLI allow tools such as Codex, Claude Code, and Cursor to inspect traces, isolate failing spans, create evaluators, curate datasets, and compare experiments. The agent can accelerate the investigation, while an engineer reviews any proposed change to the prompt, tools, evaluation criteria, or application logic.
Which agent observability metrics should you track?
Agent observability can produce more signals than your team can use. Start with one metric that proves the agent completed its assigned job, then add only the diagnostic and operational metrics needed to explain failures or enforce deployment limits.
- Measure the outcome at the workflow boundary. A support agent may use verified resolution rate, a coding agent may use test pass rate, and a research agent may use citation accuracy. Record this result at the trace or session level so it remains connected to the execution that produced it.
- Use execution signals to explain changes. Tool failures, retries, repeated retrieval, handoff errors, policy violations, P95 latency, and cost per successful task can show why outcomes changed. Choose signals that correspond to a known failure mode or an operational decision your team can make.
Raw step count, average latency, token volume, or tool-call frequency should not be treated as quality scores by themselves. A longer path may represent necessary recovery, while a short run may have failed before completing any useful work. For a fuller breakdown by agent type, risk, cost, and behavior, see Agent evaluation metrics: how to measure whether an agent works
Agent evaluation
Once you are able to see what an AI agent is doing, the next step is measuring how well it is performing. This is rarely straightforward because agents take multiple steps and follow complex paths. Static test cases will not do the trick here.
The agent-native evaluation framework explains how to think about scope, and the handbook chapter on how to evaluate AI agents in production covers the full workflow. This section stays with the part that depends directly on trace data: the two evaluator types you run against captured execution. Those are LLM as a judge and code evals.
LLM as a judge
You can prompt an LLM to assess an agent’s output and trajectories. This is a useful alternative to human or user feedback, which is expensive and usually difficult to obtain.
First identify what you want to measure, such as correctness or tool usage accuracy. Next, craft a clear evaluation prompt to tell the LLM how to assess the agent’s multi-step outputs. Then run these evaluations across your agent runs to test and refine performance without using manual labels.
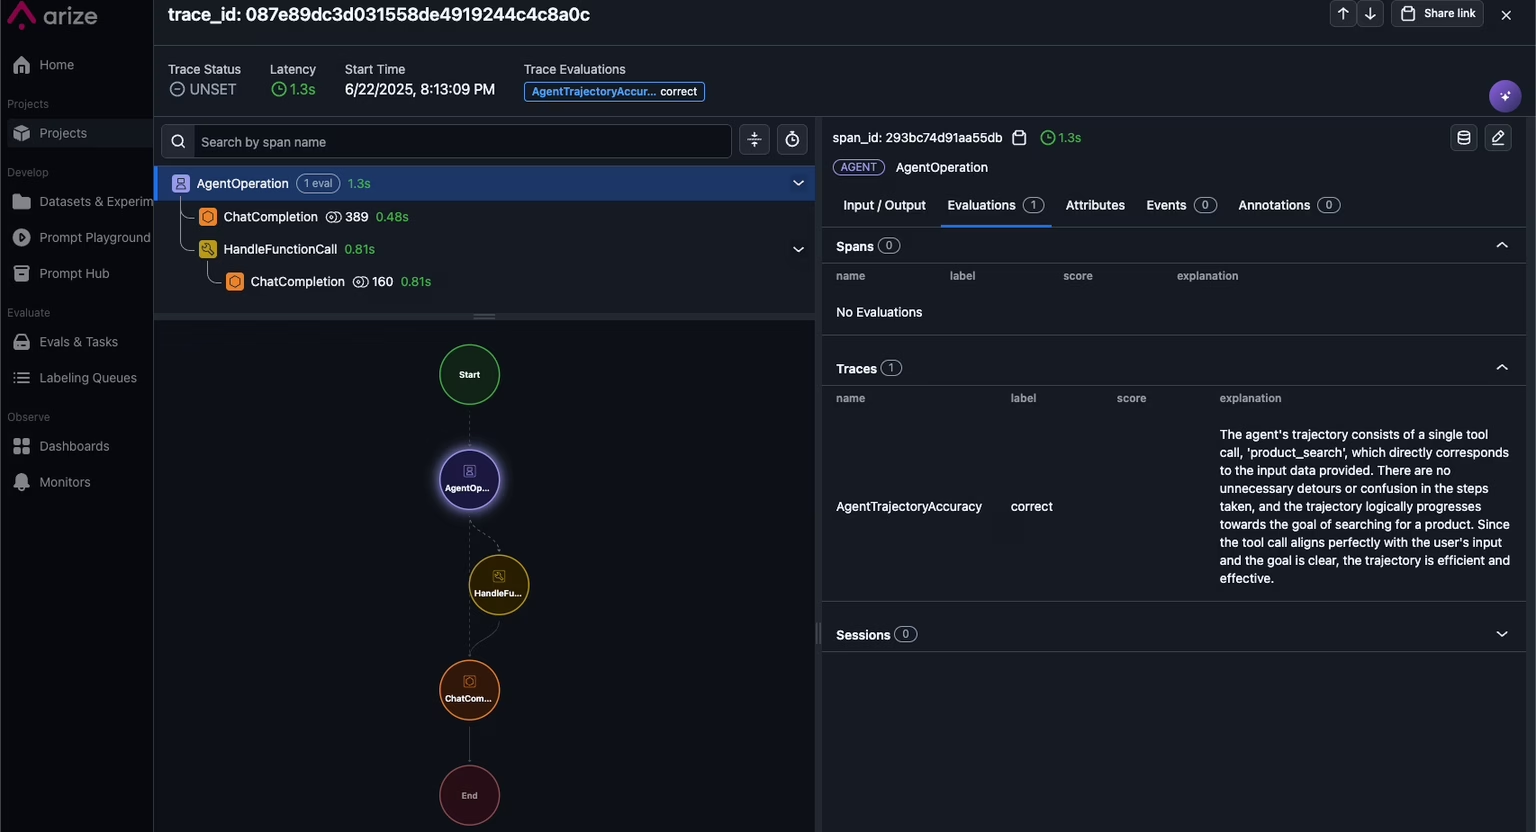
For example, agent trajectory evaluations use an LLM as a judge to assess the entire sequence of tool calls an agent takes to solve a task. The evaluator groups the tool-calling spans in a trace, sends the ordered list to the judge, and attaches the result to the root span so you can filter on it in the UI. This helps you catch loops or unnecessary steps that inflate cost and latency, and confirm that the agent follows the expected golden path.
TRAJECTORY_ACCURACY_PROMPT = """
You are a helpful AI bot that checks whether an AI agent's internal trajectory
is accurate and effective.

You will be given:
1. The agent's actual trajectory of tool calls
2. The user input that initiated the trajectory
3. The definition of each tool that can be called

An accurate trajectory:
- Progresses logically from step to step
- Uses the right tools for the task
- Is reasonably efficient (no unnecessary detours)

##
Actual Trajectory:
{tool_calls}

User Input:
{attributes.input.value}

Tool Definitions:
{attributes.llm.tools}
##

Respond with **exactly** one word: `correct` or `incorrect`.
- `correct` -> trajectory adheres to the rubric and achieves the task.
- `incorrect` -> trajectory is confusing, inefficient, or fails the task.
"""
Arize also ships pre-tested LLM-as-a-judge templates for the agent behaviors that fail most often: Tool Selection for whether the agent chose the right tool, Tool Invocation for whether the arguments and formatting were correct, and Tool Response Handling for whether the agent used the tool result correctly. The rest of the catalog, including faithfulness, hallucination, correctness, and user friction, is documented in Phoenix Evals pre-built metrics and available in the Arize AX Eval Hub.
For a component-by-component view of which question to ask at each layer of the agent, from router and planner through skills, memory, and reflection, see evaluating agents.
Code evaluations
When your evaluation relies on objective criteria that can be verified programmatically, code evals are the way to go. Think of them as the rule-following side of testing that runs quick, reliable checks to confirm the output hits all the right marks.
A good example is measuring your agent’s path convergence. When the agent takes multiple steps to reach an answer, you want to ensure it is following consistent pathways and not wandering off into unnecessary loops.
To measure convergence, run your agent on a batch of similar queries and record the number of steps taken for each run. Then calculate a convergence score by averaging the ratio of the shortest observed path to the steps taken in each run. Note that this reference path is the shortest run you observed, not a proven optimum, so the score is only comparable across batches of similar queries.
# Each entry in all_outputs is one run: the list of messages,
# which is the path taken.
all_outputs = [...]

run_lengths = [len(output) for output in all_outputs]

if run_lengths:
optimal_path_length = min(run_lengths)
convergence = sum(
optimal_path_length / run_length for run_length in run_lengths
) / len(run_lengths)
else:
optimal_path_length = 0
convergence = 0

print(f"The optimal path length is {optimal_path_length}")
print(f"The convergence is {convergence}")
A score near 1 means the agent reliably takes its shortest known path. A lower score means runs are drifting longer than they need to.
Evaluating AI agents requires looking beyond single-step outputs. By mixing evaluation strategies, using LLM as a judge for the big-picture story and code-based checks for the finer details, you get a complete view of how your agent is really doing. Evaluation methods should also be tested against ground truth datasets so they generalize to production.
Observability in multi-agent systems
Multi-agent tracing
Multi-agent tracing systematically tracks and visualizes interactions among multiple agents within an AI system. Unlike single-agent debugging, multi-agent tracing shows how agents interact, delegate tasks, and use tools. Arize AX renders those relationships as an interactive graph and path diagram in its agent trajectory views, which helps engineers follow agent communications and decisions step by step. Clear tracing identifies logical breakdowns, bottlenecks, and inefficient tool usage, enabling more effective debugging and optimization.
Unified observability across frameworks
Scaling multi-agent systems requires a unified observability framework across different agent technologies. Observability tools should integrate with frameworks such as Agno, AutoGen, CrewAI, LangGraph, and smolagents without custom implementation. Standardized observability offers consistent insights, accelerates troubleshooting, and streamlines debugging across diverse agent setups and architectures. For how these frameworks differ in the first place, see the handbook chapter on agent frameworks.
If you are still selecting a backend for this, compare agent observability tools covers the current landscape, and LLM and agent evaluation platforms covers the evaluation side of the same decision.
Session-level observability: context matters
Why session-level observability matters
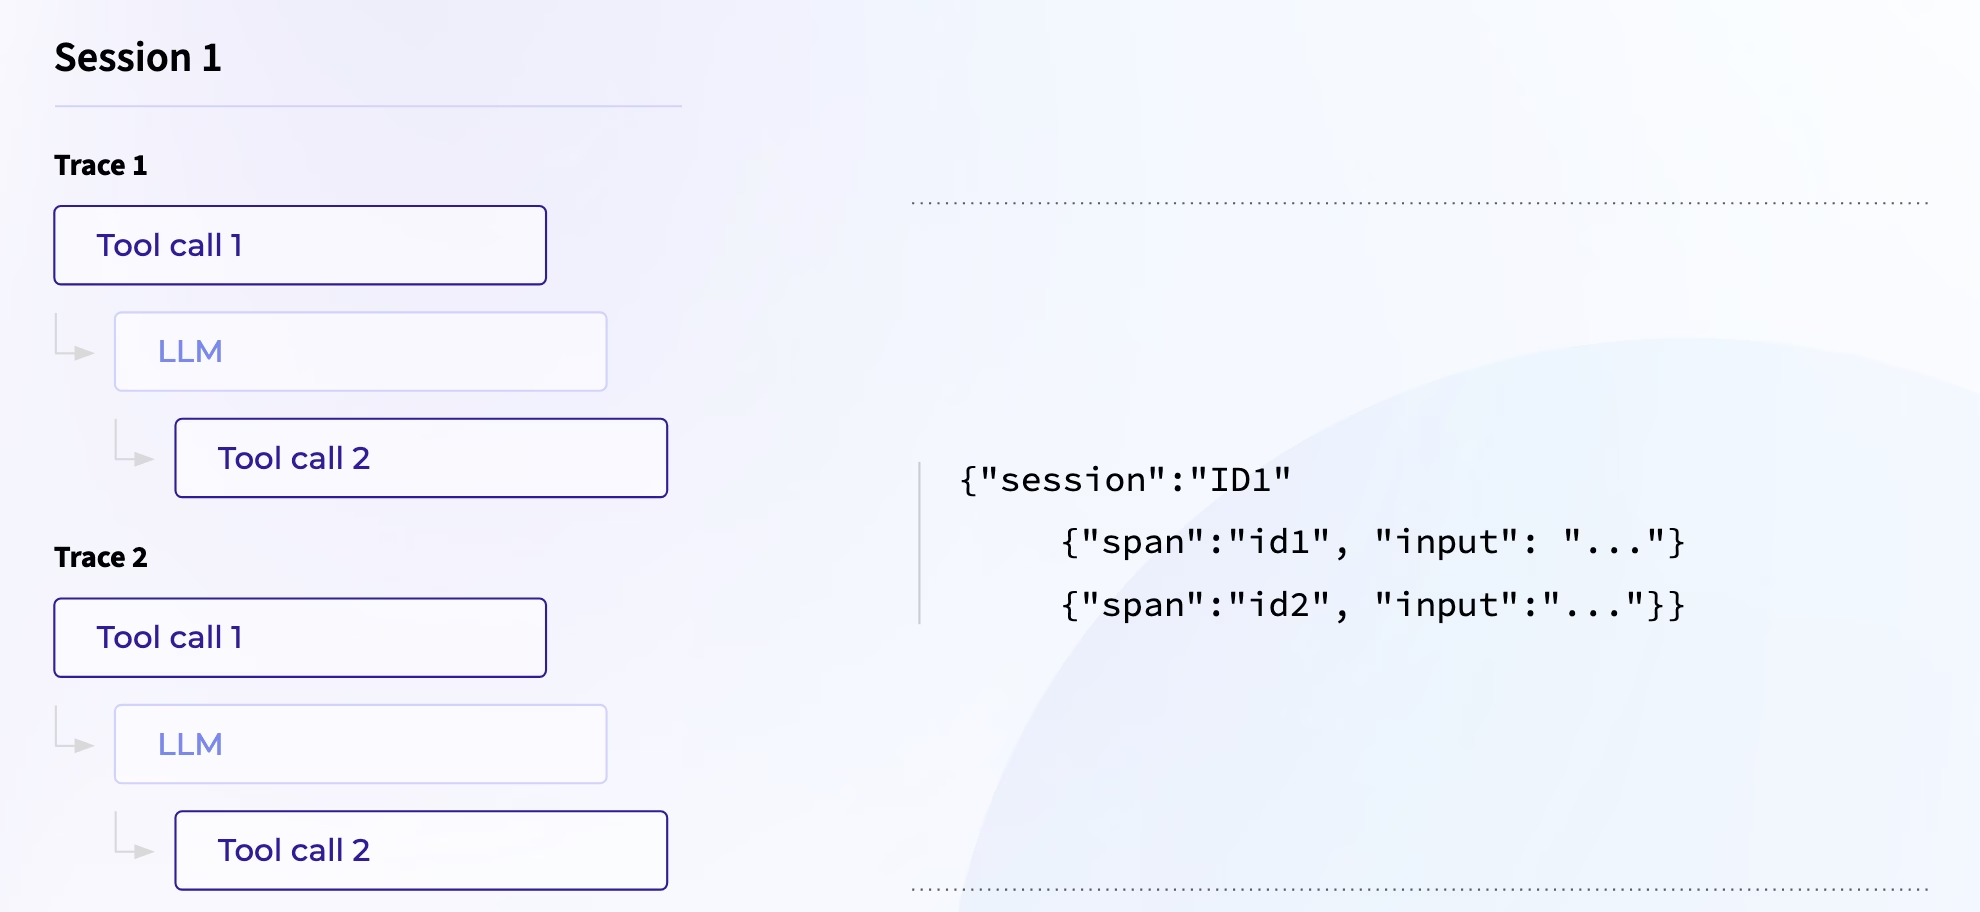
Session-level observability evaluates an agent’s performance over an entire conversational or task-based session, beyond individual interactions. This evaluation addresses coherence, or logical consistency; context retention, or building effectively on previous interactions; goal achievement, or fulfilling user intent; and conversational progression, or naturally managing multi-step interactions. Session-level observability supports reliability and context awareness in agents performing complex, multi-turn tasks.
Sessions require a shared session.id across the related traces. Once that is in place, you can run trace and session evaluations against the grouped record.
Best practices for session-level evaluation
Effective session-level evaluations require careful planning. Best practices include defining criteria for coherence, context retention, goal achievement, and conversational progression before evaluations begin. Evaluation prompts should clearly instruct the judge model on assessing these aspects. Combining automated methods such as LLM as a judge with targeted human reviews produces more comprehensive coverage. Regularly updating evaluation criteria based on evolving interactions and agent capabilities maintains continual improvement. For a worked example, see session-level evaluations for an AI tutor.
Advanced concepts
Tracing MCP clients and servers
MCP is the Model Context Protocol, an open standard that lets agents call tools, fetch resources, and receive prompts from independent server processes. It was created by Anthropic and open sourced in November 2024, and since December 2025 it has been governed as a founding project of the Agentic AI Foundation under the Linux Foundation.
Visibility gap
Developers could previously trace what was happening on the client, such as LLM calls and tool selection, or on the MCP server in isolation. Once a client made a call to an MCP server, visibility into what happened next was lost.
Context propagation
openinference-instrumentation-mcp bridges this gap, and it works differently from other instrumentors: it emits no spans of its own. It propagates OpenTelemetry context across the MCP wire protocol so that spans created independently in the client and in the server join into a single trace. That means you install MCPInstrumentor alongside a span-producing instrumentor in both processes and point both at the same project. With that in place, you get:
- Tool calls made by the client shown with their corresponding server-side execution.
- Visibility into LLM calls made by the MCP server itself.
- A full trace of the agent’s behavior across systems, all visible in Arize AX or Phoenix.
See MCP tracing for the Python setup, including the verbose=False requirement on the server so the Arize banner does not corrupt the stdio wire protocol, or MCP tracing for TypeScript.
Voice and multimodal observability
Multimodality brings new challenges and opportunities for agent observability. Unlike pure text workflows, these agents process voice, images, and other data types.
Tracing multimodal agents helps you align transcriptions, image embeddings, and tool calls within a unified view, making it easier to debug tricky misinterpretations such as a faulty transcription. Tracing also surfaces latency per modality, which is crucial since voice and image processing can introduce hidden bottlenecks that quickly erode the user experience. OpenInference adds voice-specific span kinds and attributes for this, including audio transcripts, audio token counts, and time_to_first_token_ms, the metric that best reflects perceived voice-agent responsiveness.
Evaluation for multimodal agents relies heavily on checking whether the agent understood and responded to its inputs correctly. Using LLM as a judge, you can assess whether an image caption matches the uploaded image or whether a transcribed voice command triggered the right tool call. Code-based checks add another layer by catching deterministic issues, such as missing required objects in generated captions or verifying that a response aligns with structured data pulled from an image. The Arize tracing and evaluating audio cookbook walks through an end-to-end example.
The ultimate goal: self-improving agents
While we’ve talked a lot about how observability helps you catch problems, it’s also While we have talked a lot about how observability helps you catch problems, it is also about systematically making your agents better over time. With structured traces and evaluations in place, you can spot patterns in failures and identify which prompts or tool strategies consistently perform best.
Start by reviewing outlier traces and low-scoring evals to pinpoint where your agent is struggling the most. Dig into why these failures happen. Is it poor retrieval that returns irrelevant chunks? Is a brittle prompt confusing your LLM? These are the insights you can use to refine prompts, adjust tool call logic, and improve your data pipelines where it matters most.
Once improvements are made, rerun evals across your historical data to measure the true impact of your changes against your real workload. This confirms progress and avoids regressions that slip past manual checks.
Improvement flows can also include automation. With automated prompt optimization, you can generate and test new prompt versions using your labeled datasets and feedback loops. Instead of endless trial and error, your prompts evolve as your use cases and data change.
Self-improving agents take this a step further. By feeding low-scoring traces and failed evals back into your pipelines, your agents can learn from their mistakes. Instead of staying static, they become systems that adapt as they scale. This loop is one of the defining practices of AI engineering as an application-engineering discipline.
Start observing your agents
Start with one agent workflow whose outcome you can verify. Instrument the model calls, retrieval, tools, and state changes involved, then inspect the complete trace when the agent succeeds or fails. This gives you a concrete execution record before you add broader monitoring or evaluation.
Arize Phoenix provides an open-source way to begin. You can run it locally, use Phoenix Cloud, or self-host it in your own infrastructure. Start by tracing one consequential workflow, then add evaluations and datasets as recurring failure patterns become clear. A governed continual learning loop turns those production traces and evaluation results into tested, reversible improvements.
When your observability workflow needs continuous production evaluations, monitors, shared investigation, or greater operational scale, Arize AX provides a managed path forward. Both products build on OpenTelemetry and OpenInference, so the execution data you capture remains structured around the same traces, spans, and agent behavior.
Related documentation and code
- Arize AX tracing concepts: See how traces, spans, OpenTelemetry, and OpenInference fit together.
- Set up tracing in Arize AX: Choose automatic instrumentation or define custom spans.
- Explore traces and sessions in Arize AX: Investigate individual runs and multi-turn behavior.
- Set up agent trajectory and path: Add the span attributes that render handoffs and subagents as a graph.
- Phoenix tracing tutorial: Build and instrument a working TypeScript support agent with tracing, annotations, and sessions.
- OpenInference repository: Browse semantic conventions, instrumentors, and implementation examples.
Frequently asked questions
What is the difference between agent and LLM observability?
LLM observability focuses on what happens around model calls, including prompts, responses, retrieved context, token usage, latency, and model-level quality.
Agent observability covers the wider execution system in which those calls occur, including tool use, state, memory, handoffs, and the trajectory across a task or session. Because an agent often contains several model calls, agent observability includes LLM observability but extends it to whether the complete workflow behaved correctly.
How is agent observability different from monitoring?
Monitoring watches defined signals over time and alerts you when a threshold or expected pattern changes. Agent observability provides the execution records needed to investigate that signal. Monitoring might show that tool failures increased; observability lets you inspect the tools, inputs, responses, and execution paths behind the increase.
How is agent observability different from agent evaluation?
Agent observability records what happened during a run. Agent evaluation applies defined criteria to that record to judge whether the outcome, trajectory, tool use, and constraints were acceptable. An evaluation can flag a failed or inefficient run; the connected trace provides the evidence needed to understand the verdict and locate where behavior diverged. The agent-native evaluation framework covers how to define those criteria.
How do OpenTelemetry and OpenInference support agent observability?
OpenTelemetry provides vendor-neutral APIs, SDKs, and protocols for creating and exporting telemetry. It supplies the tracing foundation, including trace IDs, spans, parent-child relationships, timing, and propagation across services.
OpenInference adds semantic conventions for AI applications. It identifies operations such as agents, model calls, tools, and retrieval, then standardizes the attributes that describe them. Together, the two standards let you send structured agent traces to Arize AX, Phoenix, or another OpenTelemetry-compatible collector. Arize AX also normalizes native OpenTelemetry gen_ai.* spans into OpenInference at ingestion, so frameworks that emit GenAI conventions render correctly without a client-side reshape.
How do you observe a multi-agent system?
Observe a multi-agent system as one end-to-end workflow. Use a root trace for the user request or job, create an agent span for each agent’s work, and preserve parent-child relationships through routing and handoffs. Capture agent identity, handoff content, tool activity, shared-state changes, and final ownership so the trace shows how work moved through the system.
Use a session ID when the workflow spans multiple turns or related requests. Evaluate both levels: whether the complete system finished the task and whether each agent routed, acted, and handed off work correctly.
This prevents the final coordinating agent’s response from becoming the only evidence of how the system performed.

