


Can LLMs reduce the effort involved in anomaly and drift detection, sidestepping the need for parameterization or dedicated model training? Part two in our series on applying large language models to tabular data sets out to answer that question!
This blog is co-authored by Aparna Dhinakaran, CPO and Co-Founder of Arize AI, and Christopher Brown, CEO and Founder of Decision Patterns
💡 Want to try it yourself? Follow along with this blog’s accompanying Colab ✨
Introduction
Recent advances in large language models (LLM) are proving to be a disruptive force in many fields (see: Sparks of Artificial General Intelligence: Early Experiments with GPT-4). Like many, we are watching these developments with great interest and exploring the potential of LLMs to affect workflows and common practices of the data science and machine learning field.
In our previous piece, we showed the potential of LLMs to provide predictions using tabular data of the kind found in the Kaggle competitions. With little or no effort (i.e. data cleaning and/or feature development), our LLM-based models could score in the mid-eighties percentile of several competition entries. While this was not competitive with the best models, the little effort involved made it an intriguing additional predictive tool and an excellent starting point.
This piece tackles another common challenge with data science and machine learning workflows: drift and anomaly detection. Machine learning models are trained with historical data and known outcomes. There is a tacit assumption that the data will remain stationary (e.g. unchanged with respect to its distributional characteristics) in the future. In practice, this is often a tenuous assumption. Complex systems change over time for a variety of reasons. Data may naturally change to new patterns (via drift), or it may change because of a presence of new anomalies that arise after the training data. The data scientist responsible for the models is often responsible for monitoring the data, detecting drift or anomalies, and making decisions related to retraining the models. This is not a trivial task. Much literature, methodologies, and best practices have been developed to detect drift and anomalies. Many solutions employ expensive and time-consuming efforts aimed at detecting and mitigating the presence of anomalies on production systems.
We wondered: can LLMs reduce the effort involved in drift and anomaly detection?
Using Pre-Trained LLMs for Anomaly Detection in Tabular Data: a Simple and Efficient Approach
This piece presents a novel approach to anomaly and drift detection using large language model (LLM) embeddings, UMAP dimensionality reduction, non-parametric clustering, and data visualization. Anomaly detection (sometimes also called outlier detection or rare-event detection) is the use of statistics, analysis, and machine learning techniques to identify data observations of interest. The approach outlined here is readily available in the Arize SDK and platform.
To illustrate this approach, we use the California Medium Home Values dataset available in SciKit learn package. We synthesize small regions of anomalous data by sampling and permuting data. The synthetic data is then well-hidden within the original (i.e. “production”) data. Experiments were conducted varying the fraction of anomalous points as well as the “degree of outlierness” – essentially how hard we would expect to find the anomalies. The procedure then sought to identify those outliers. Normally, such inlier detection is challenging and requires selection of a comparison set, a model training, and/or definitions of heuristics.
We demonstrate that the LLM model approach can detect anomalous regions containing as little as 2% of data at an accuracy of 96.7% (with approximately equal false positives and false negatives). This detection can detect anomalous data hidden in the interior of existing distributions. This method can be applied to production data without labeling, manual distribution comparisons, or even much thought. The process is completely parameter and model-free and is an attractive first step toward outlier detection.
Visualizing and Detecting Anomalies in Tabular Data Using Pre-Trained LLMs: Our Approach
A common challenge of model observability is to quickly and visually identify unusual data. These outliers may arise as a result of data drift (organic changes of the data distribution over time) or anomalies (unexpected subsets of data that overlay expected distributions). Anomalies may arise from many sources, but two are very common. The first is an (usually) unannounced change to an upstream data source. Increasingly, data consumers have little contact with data producers. Planned (and unplanned) changes are not communicated to data consumers. The second issue is more perfidious: adversaries performing bad actions in processes and systems. Very often, these behaviors are of interest to data scientists.
In general, drift approaches that look at multivariate data have a number of challenges that inhibit their use. A typical approach is to use Variational Autoencoders (VAEs), dimensional reduction, or to combine raw unencoded data into a vector. This often involves modeling past anomalies, creating features, and checking for internal (in)consistencies. These techniques suffer from the need to continuously (re)train a model and fit each dataset. In addition, teams typically need to identify, set, and tune a number of parameters by hand. This approach can be slow, time-consuming, and expensive.
Here, we apply LLMs to the task of anomaly detection in tabular data. The demonstrated method is advantageous because of its ease of use. No additional model training is needed, dimensionality reduction makes the problem space visually representable, and produces a candidate of anomalous clusters. The use of a pre-trained LLM to sidesteps needs for parameterization, feature engineering, and dedicated model training. The pluggability means the LLM can work out of the box for data science teams.
Data and Methodology
For this example, we use the California Home Values from the 1990 US Census (Pace et al, 1997) that can be found online and is incorporated in the SciKit-Learn Python package. This data set was selected because of its cleanliness, use of continuous/numeric features, and general availability. We have performed experiments on similar data. Note: For a more complete example of the process, please refer to the accompanying notebook.
Synthesizing Anomalies: What Are the Three Factors Governing Anomaly Detection?
Consistent with previous investigations, we find the ability to detect anomalies governed by three factors: (a) the number of anomalous observations, (b) the degree of outlierness or the amount those observations stick out of a reference distribution, and (c) the number of dimensions on which the anomalies are defined.
The first factor should be apparent. More anomalous information leads to faster and easier detection. Determining a single observation is anomalous is a challenge. As the number of anomalies grows, it becomes easier to identify.
The second factor, the degree of outlierness, is critical. In the extreme case, anomalies may exceed one or more of allowable ranges for their variables. In this case, outlier detection is trivial. Harder are those anomalies hidden in the middle of the distribution (i.e. “inliers”). Inlier detection is often challenging with many modeling efforts throwing up their hands at any sort of systematic detection.
The last factor is the number of dimensions used upon which the anomalies are defined. Put another way, it’s how many variables participate in the anomalous nature of the observation. Here, the curse of dimensionality is our friend. In high dimensional space, observations tend to become sparse. A collection of anomalies that vary a small amount on several dimensions may suddenly become very distant to observations in a reference distribution. Geometric reasoning (and any of various multi-dimensional distance calculations) indicate that a greater number of affected dimensions tends to easier detection and lower detection limits.
In synthesizing our anomalous data, we have affected all three of these variables (see colab notebook). We conducted an experimental design in which (a) the number of anomalous observations ranged from 1% to 10% of the total observations, (b) the anomalies were centered around the 0.50 – 0.75 quantile, and (c) the number of variables were affected from 1 to 4.
Using LLMs for Anomaly Detection: A Prompt-Based Approach
Our method uses prompts to get the LLM to provide information about each row of the data. The prompts are simple. For each row/observation, a prompt consists of the following:
The <column name> is <cell value>. The <column name> is <cell value>. …”
This is done for each column creating a single continuous prompt for each row. Two things to note:
- It is not necessary to generate prompts for training data, only the data about which the anomaly detection is made.
- It is not strictly necessary to ask whether the observation is anomalous (though this is a topical area for additional investigation).
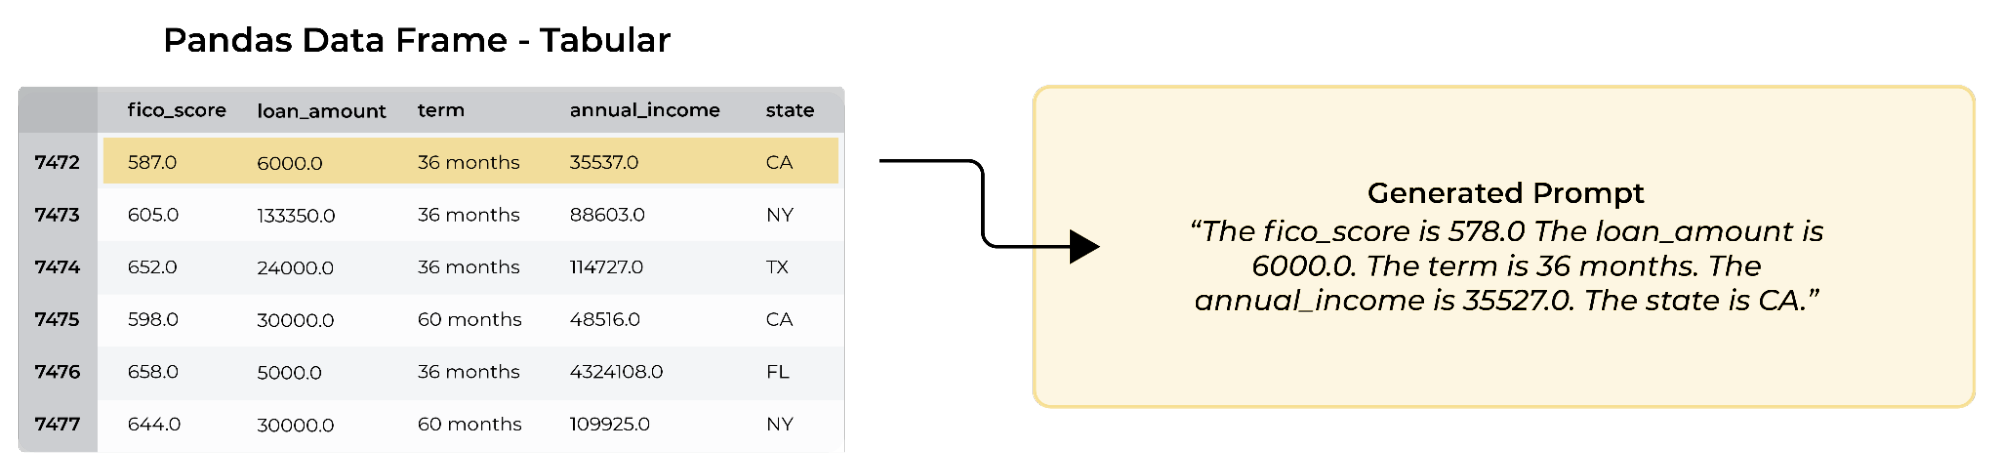
Example of a prompt created from tabular data. Each row of data is encoded as a separate prompt and made by concatenating a simple statement from each cell of the row.
Once provided to the LLM, the textual response of the model is ignored. We are only concerned with the embeddings (e.g. embedding vector) for each observation. The embedding vector is critical because each embedding vector provides the location of the observation in reference to the LLM training. Although the actual mechanisms are obscured by the nature and complexity of the neural network model, we conceive of the LLM as constructing a latent response surface. The surface has incorporated Internet-scale sources, including learning about home valuations. Authentic observations – such as those that match the learnings – lie on or close to the response surface; anomalous values lie off the response surface. While the response surface is largely a hidden artifact, determining anomalies is not a matter of learning the surface but solely identifying the clusters of like values. Authentic observations lie close to one another. Anomalous observations lie close to one another, but the sets are distinct. Determining anomalies is simply a matter of analyzing those embedding vectors.
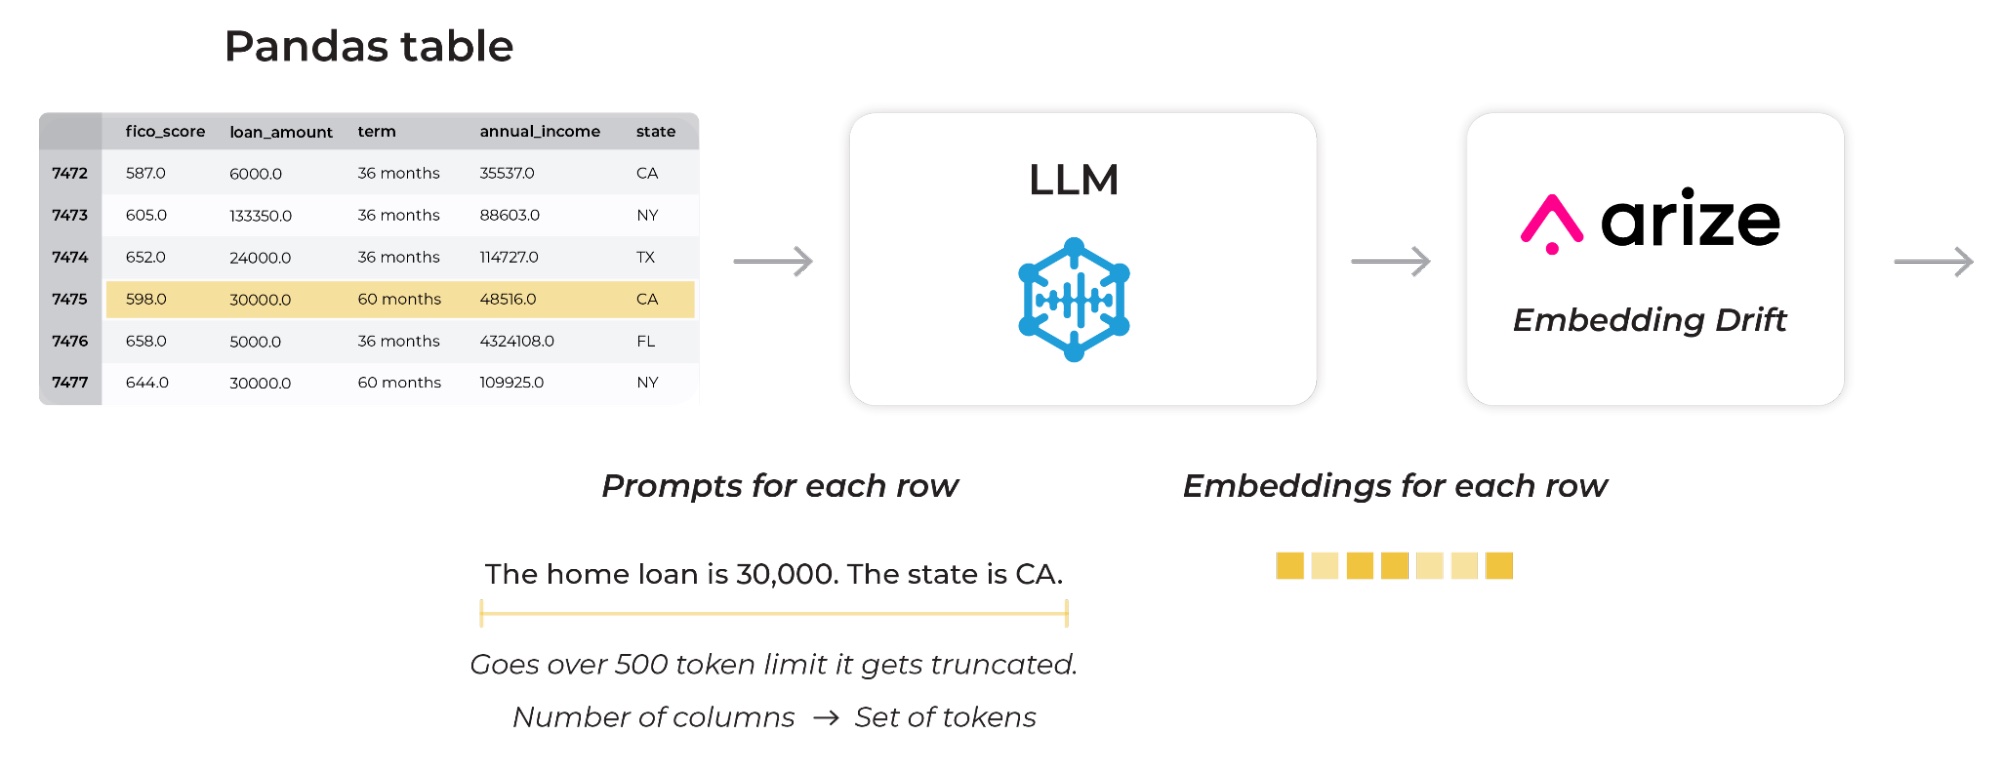
The LLM captures structure of both numeric and categorical features. The picture above shows each row of a tabular data frame and prediction of a model mapped onto embeddings generated by the LLM. The LLM maps those prompts in a way that creates topological surfaces from the features based on what the LLM was trained on previously. In the example above, you can see the numeric field X/Y/Z as low values on the left and high values on the right.
Visualization: Dimension Reduction, Clustering and Anomaly Identification
For the analysis of the embeddings, we chose tools that are readily available in the Arize platform through the embeddings feature.
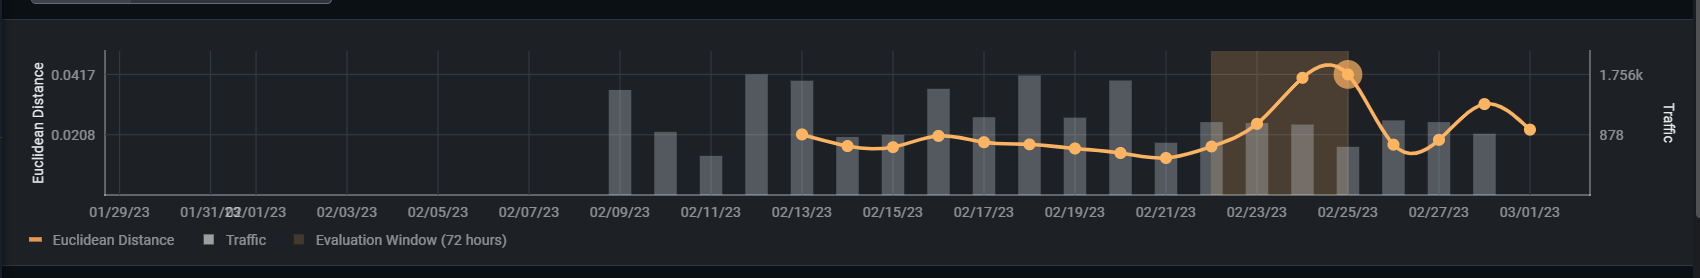
Screen capture of a Euclidean Distance plot that provides a rough indication whether anomalies are present in the data. The bump near the right side of the graph is consistent with the synthetic anomalies introduced into the data. Positioning the plot’s time window on the bump will make data from that date range available in the UMAP Comparison on the bottom half of the Embeddings tab.
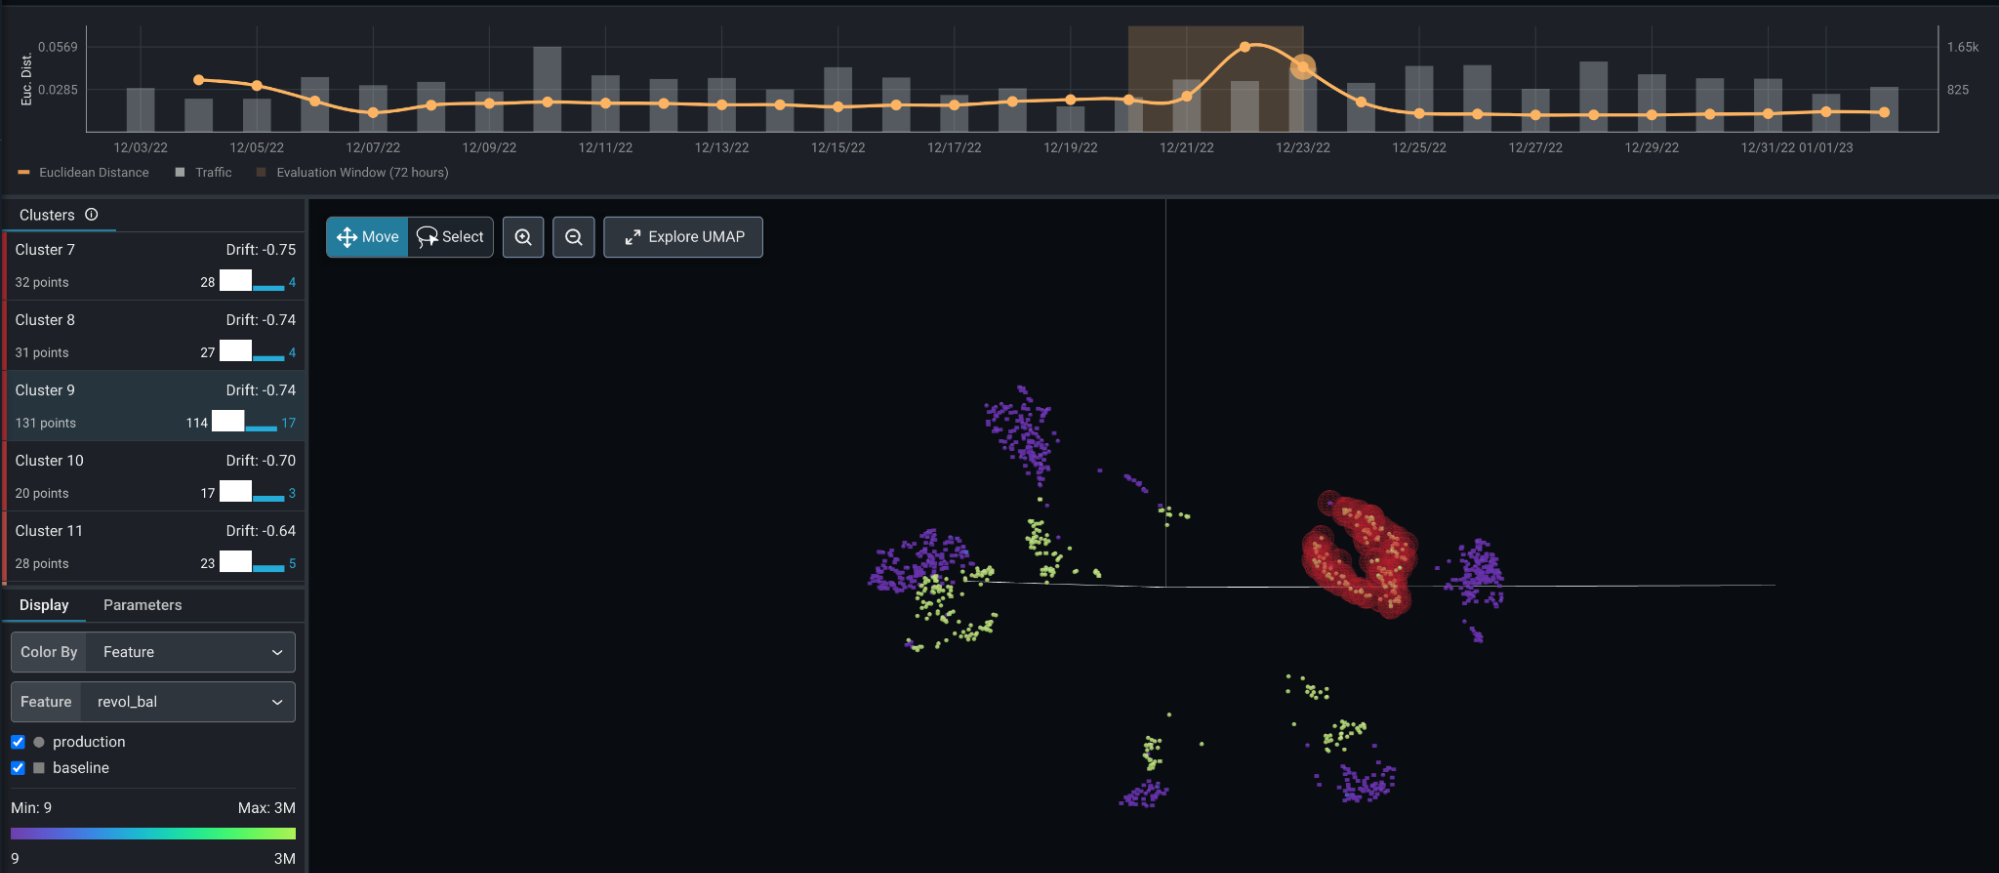
Arize’s embeddings functionality performs the analysis automatically. This includes a Euclidean distance measurement over time, UMAP dimensionality reduction to two or three visual dimensions. The UMAP algorithm is an important innovation as it seeks to preserve geometries such that it optimizes for close observation remaining close and distant observations remaining distant. After dimensional reductions, Arize applies clustering to find dense, similar clusters. These are then compared to a reference distribution which can be used to highlight anomalous or drifted clusters. Although there are some options that control the visualizations, most of these steps are parametric free. In the end, the user is provided with a cluster of identified data points identified as outliers. The platform allows examination of the anomalous clusters as well as individual data points within these clusters. These can then be queued for further examination and analysis.
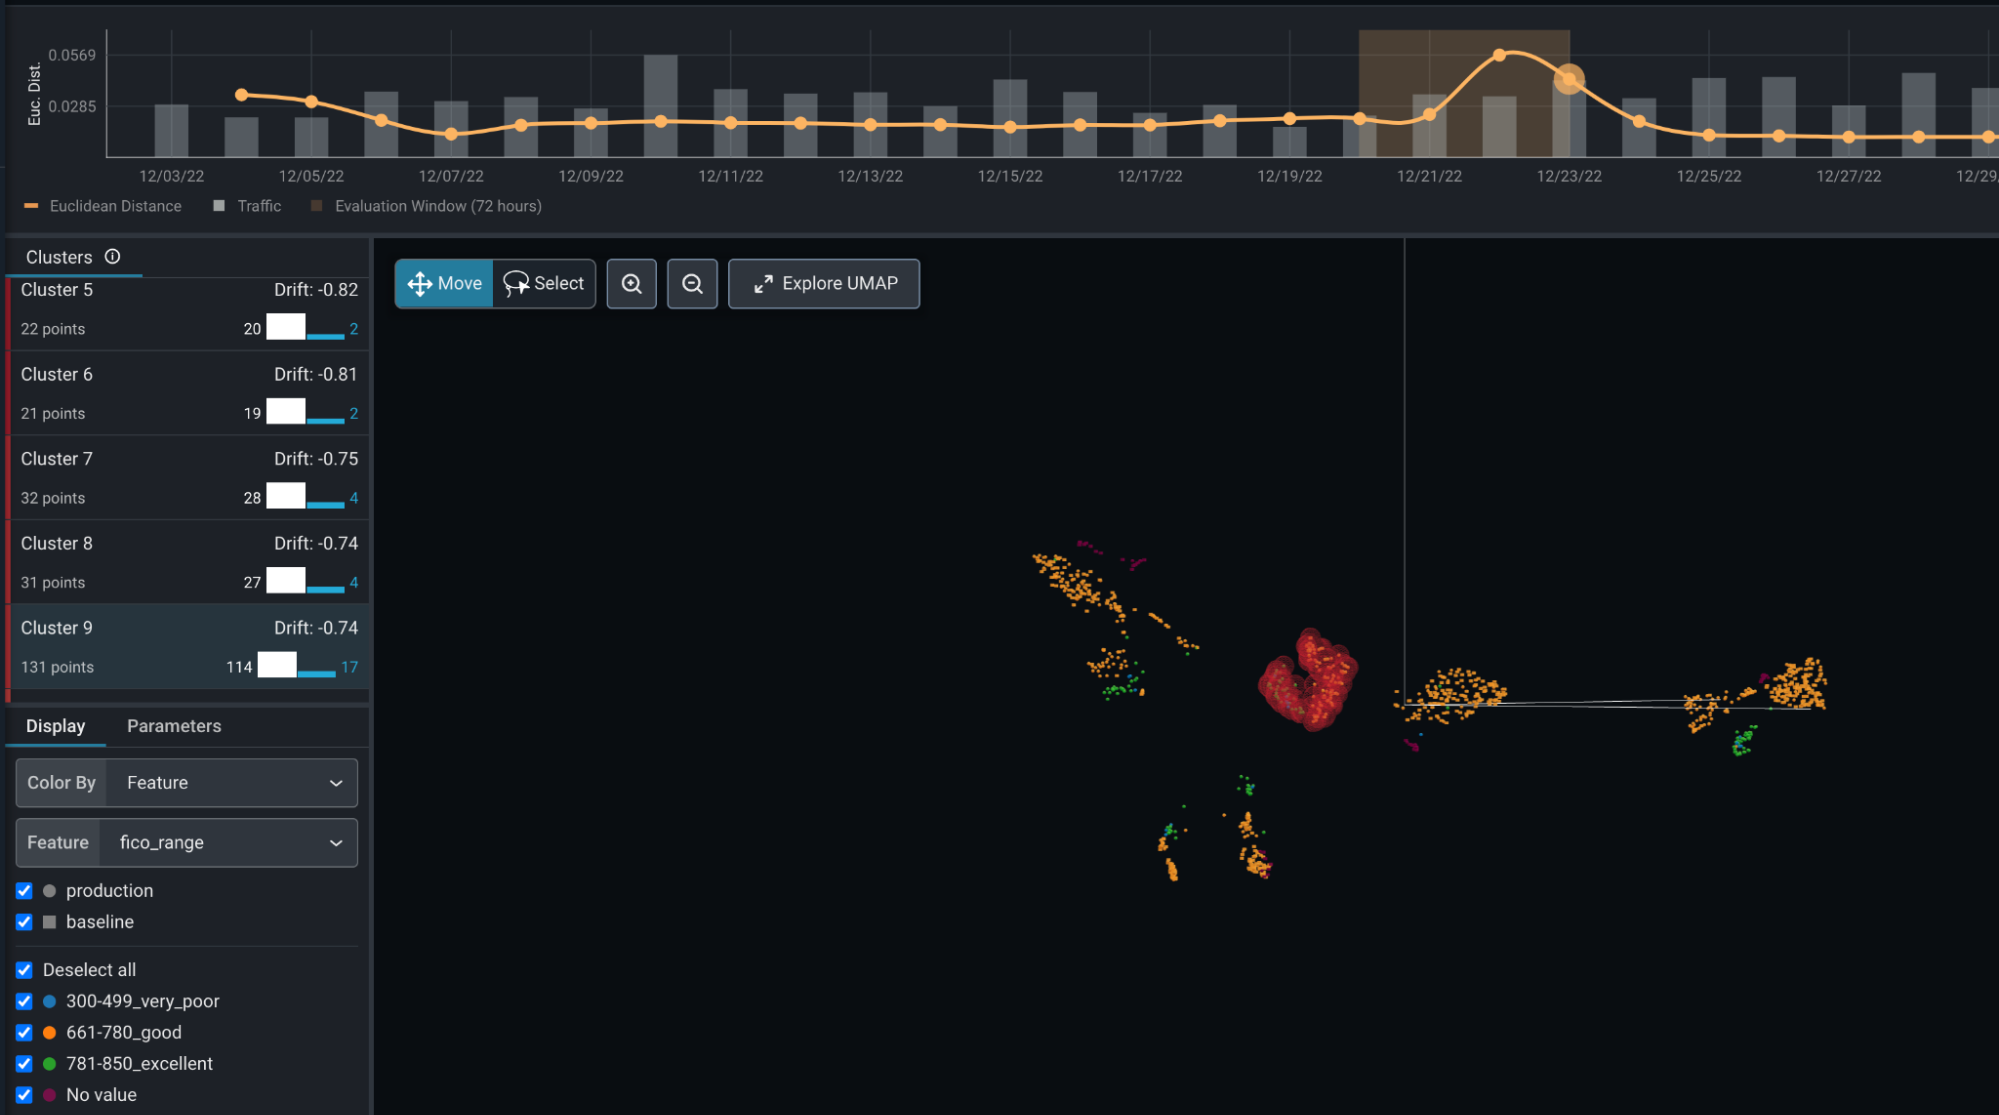
Embedding Drift: above is a screen capture of the Arize platform performing a UMAP dimensionality reduction, clustering, and automatic (anomalous) cluster detection through comparison to a reference distribution. Drifted or anomalous points are automatically highlighted in red and can be queued for further analysis including reinforcement learning with human feedback.
Experiment Results
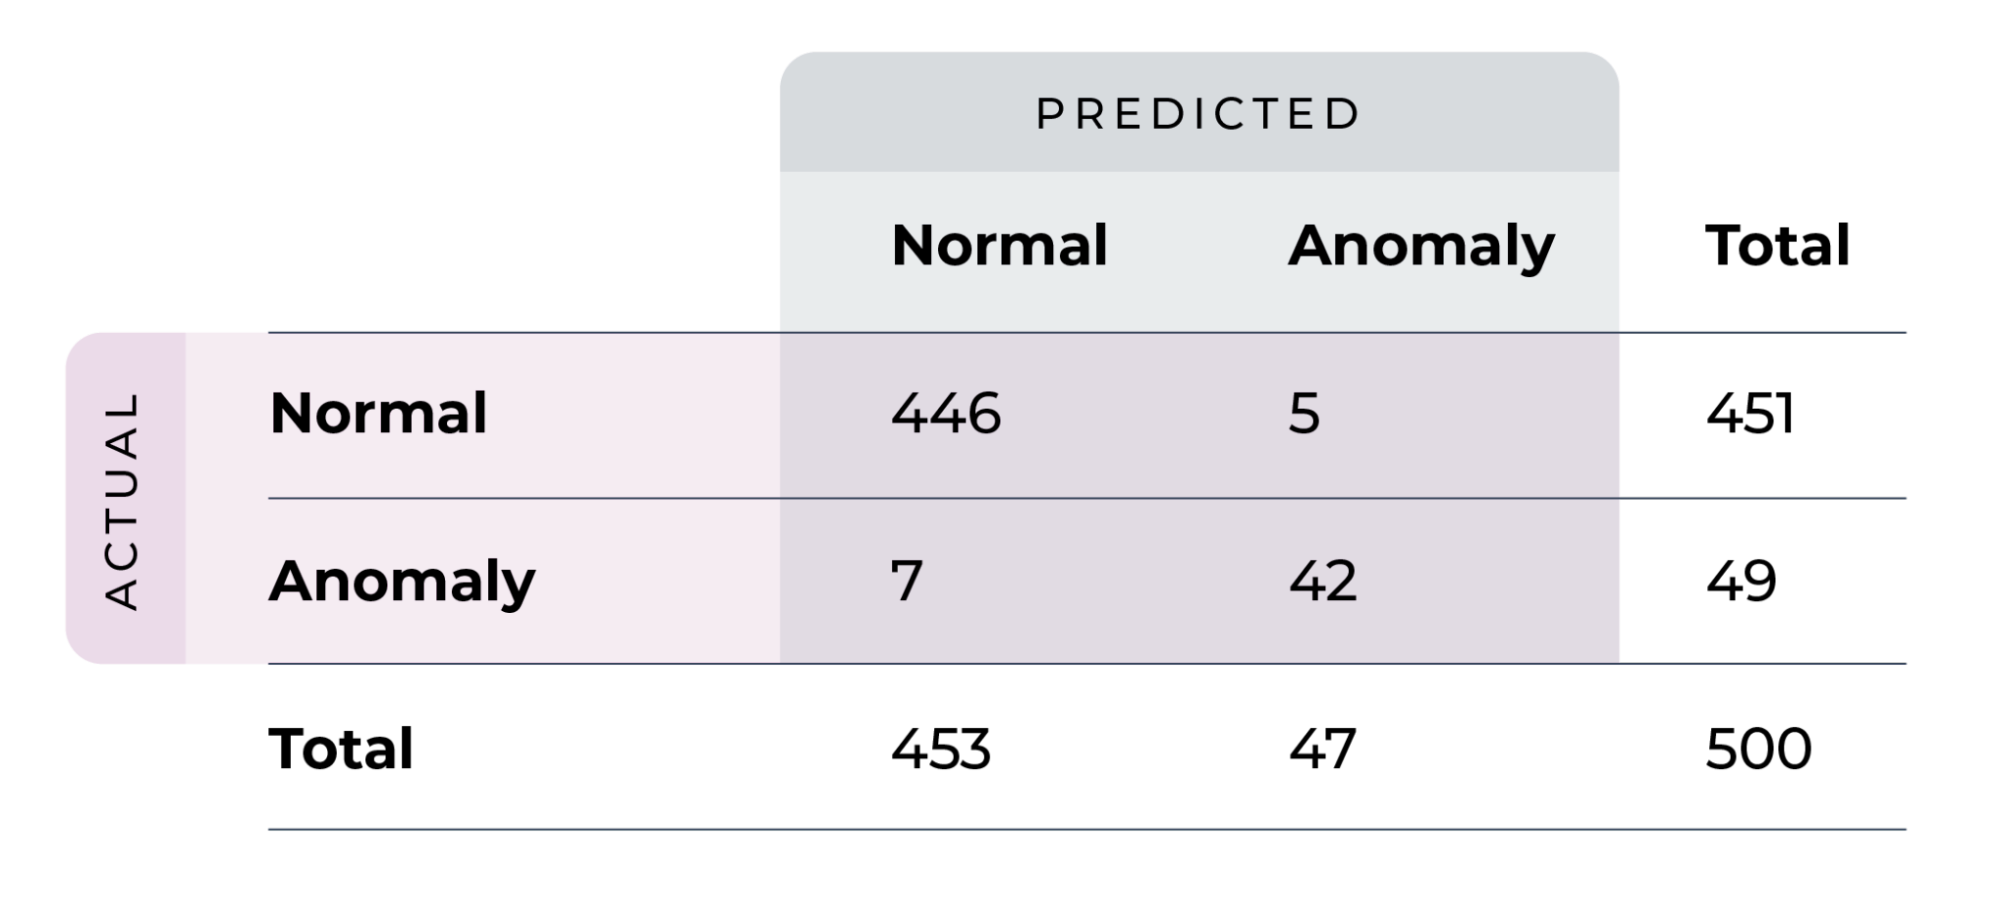
We explored a wide variation of conditions for detecting anomalies, varying the number of anomalous variables, the fraction of anomalies, and the degree of outlierness. In these experiments, we were able to detect anomalous regions equalled or exceeded 2% of the data even when values tended near the median of distributions (centered +/- 5 centiles of the median). In all five repetitions of the experiment, the method automatically found and identified the anomalous region and made it visibly apparent as seen in the section above. In identifying individual points as members of the anomalous cluster, the method had a 97.6% accuracy with a precision of 84% and a recall of 89.4%.
Summary of Results
| Anomalous Fraction | 2% |
| Anom Quantile | 0.55 |
| Anomaly Cols | 4 |
| Accuracy | 97.6% |
| Precision | 84.0% |
| Recall | 89.4% |
Confusion Matrix
Conclusion and a Look Ahead
This piece demonstrates the use of pre-trained LLMs to help practitioners identify drift and anomalies in tabular data. During tests over various fractions of anomalies, anomaly locations, and anomaly columns, this method was in most cases able to detect anomalous regions of as few as 2% of the data centered within five centiles from the median of the variables’ values. We do not claim that such a resolution would qualify for rare-event detection, but the ability to detect anomalous inliers was impressive. More impressive is this detection methodology is non-parametric, quick and easy to implement, and visually-based.
The utility of this method derives from the tabular-based data prompts presented to the LLMs. During their training, LLMs map out topological surfaces in high dimensional spaces that can be represented by latent embeddings. Those high dimensional surfaces mapped out by the predictions represent combinations of features in the authentic (trained) data. If drifted or anomalous data are presented to the LLMs, those data appear at different locations on the manifold farther from the authentic/true data.
The method described above has immediate applications to model observability and data governance, allowing data organizations to develop a service level agreement|understanding (SLA) with the organizations. For example, with little work, an organization could claim that it will detect all anomalies comprising 2% volume of the data within a fixed number of hours of first occurrence. While this might not seem like a great benefit, it caps the amount of damage done from drift/anomalies and may be a better outcome than many organizations achieve today. This can be installed on any new tabular data sets as those data sets come on. From there and if needed, the organization can work to increase sensitivity (decrease the detection limits) and improve the SLA.