


Model Monitoring
Learn why model monitoring is critical for modern ML teams and how to set up alerts and monitors to catch common issues
What is Model Monitoring?

Machine learning (ML) model monitoring is a series of techniques used to detect and measure issues that arise with machine learning models and deployed large language model (LLM) systems. Once configured, monitors fire when a model metric crosses a threshold. Areas of focus for monitoring include model performance, data quality, drift detection, and embedding analysis.
Why Is Model Monitoring Important?
A lot can go wrong with a production model, and navigating model issues can be challenging for even the most seasoned AI engineer or ML practitioner. With model monitoring, you can immediately know when issues arise in machine learning models. Better insights empower data scientists, developers and engineers to pinpoint where to begin further analysis.
Model Monitoring Improves Business Outcomes
Despite the multitude of problems a model can encounter in the real world, over half of ML teams lack a reliable way to proactively surface when something is going wrong with a model in production. Many rely on batch in-house solutions or dashboards that may not catch issues in time, or tools that are not purpose-built for machine learning or evaluating LLM systems. Even the best teams have blindspots. In an era where AI is relied on to increase profitability and even save lives, it’s clear that better model monitoring is critical — particularly as generative AI enters the mainstream and only 30.1% have LLM monitoring or observability in place.
The Basics of Model Monitoring
Below, you’ll find some building blocks that can help in starting your model monitoring journey.
Performance analysis monitoring Daily or hourly checks on model performance such as accuracy above 80%, RMSE, accuracy above training
Jump to section
Drift monitoring Distribution comparisons, numeric or categorical on features, predictions, and actuals
Jump to section
Model Monitoring Resources
The Definitive Machine Learning Observability Checklist
Read more →The Three Types of Observability Your System Needs
Read more →Model Performance Management
Model performance indicates how your model performs in production. Measure model performance with an evaluation metric, which can be evaluated with daily or hourly checks on metrics such as accuracy, recall, precision, F-score, MAE, MAPE, and more – your model type directs which performance metrics are applicable to your model.
Performance monitor recommendations:
Performance monitors measure performance based on an evaluation metric. You can use performance metrics to compare model behavior between different environments and use those insights to drill into the root cause of performance degradation. It’s important to look at the performance of models across various cohorts and slices of predictions.
Set a monitoring threshold to alert you when your model’s behavior deviates significantly from expected values during a high-performing time period of any environment.Send data from different environments to compare model performance between training, validation, or a different time period within your production data. Comparing your production data helps you identify gaps in data quality or where drift occurs for simple troubleshooting. If you have delayed actuals (aka ground truth) for your production model, use proxy metrics to evaluate model performance. The most common leading indicators of model performance are change in prediction score or class, feature drift, and prediction score or class distribution drift. For example, you could monitor for drift in the average prediction score distribution.

Performance Analysis Resources
LLM Monitoring
Given two-thirds of enterprise AI teams are planning production deployments of LLMs, evaluating and monitoring LLM applications and systems is critical.
Monitoring an LLM system means looking at everything you control – the application, prompt template, and response – to stay ahead of potential problems like hallucinations, proliferation of calls from needless abstraction, bad retrieval, or poor-quality responses.
Defining fields that designate LLM token usage and latency is often a first step, enabling teams to visualize core attributes of LLM systems and effectively keep costs down. From there, plugins can be added for trace instrumentation to automatically collect spans for your application and export them for collection and visualization (example: for Phoenix, instrumentors are managed via OpenInference).
LLM observability can further help with LLM evaluation, traces and spans, retrieval augmented generation, LLM prompt engineering, and fine-tuning.

Drift Monitoring
Drift monitors measure distribution drift, which is the difference between two statistical distributions. Since models are trained with polished data to represent production environments, it’s common for real-world production data to deviate from training parameters over time. Measure drift to identify if your models have grown stale, you have data quality issues, or if there are adversarial inputs in your model.
Drift monitor recommendations:
To detect drift over time, set your baseline using training data to identify how your model changes between your features, predictions, and actuals. To detect short-term drift, set your baseline using historical production data (i.e. two weeks).
With proactive monitoring, detecting drift should be easy with automatic alerts. Bulk-create monitors with multiple baselines, view feature performance at a glance, access a historical view of your drift, and access the distribution view associated with your drift metric.


Drift Resources
Data Quality Monitoring
Model health depends on high-quality data that powers model features, so it’s important to immediately surface data quality issues to identify how your data quality maps to your model’s performance. Data quality monitors help identify key data quality issues such as cardinality shifts, data type mismatch, missing data, and more.
Data quality monitor recommendations:
ML models rely on upstream data to train and make predictions. Data is commonly collected from multiple systems, vendors, or can be owned by another team, making it difficult to ensure you always have high-quality data. Since poor-performing data can lead to poor-performing models, use data quality monitors to detect shifts in upstream data and alert underlying changes. Configure data quality monitors to detect data issues like change in cardinality and change in percent of missing values.
💡PRO TIPS:
- Vendor data is a common cause of data quality issues. If you purchase data from a third party, use data quality monitors to alert you when the data provided by your vendor changes.
- Feature stores provide a one-stop shop for all model data. Set up monitors and alerts for all the features available in a feature store to detect issues and maintain the high-quality features downstream models rely on.
Monitoring Unstuctured Data
Most companies building computer vision (CV) models lack a window into how their models are performing in production, running the risk of models impacting earnings or acting in unfair ways.
Since deep learning models rely on human labeling teams, identifying new patterns in production and troubleshooting performance can be tricky.
CV model monitoring recommendations:
Visualizing and monitoring embeddings — vector representations of data where linear distances capture structure — is the answer.
By monitoring embeddings, ML teams can proactively identify when their unstructured data is drifting. UMAP (Uniform Manifold Approximation and Projection) visualizations can also help isolate new or emerging patterns, underlying data changes, and data quality issues.

Monitors Configuration Guide
Typically, you can configure monitors in three ways:
- One-by-one: customize monitors for the dimensions that matter the most to you
- Bulk automatically: toggle on all monitors types in a few clicks for a simple setup
- Programmatically: Arize’s public-facing graphQL API, for example, enables programmatic configuration of monitors
Whether you decide to customize your monitors from scratch, edit premade monitors, or set them up programmatically, make sure you choose an appropriate baseline, threshold, and evaluation metric.

Choose a Baseline
Baselines are datasets used to compare the distributions of two environments. There are a variety of baselines to use that detect different potential model issues.
Production data against training data baseline: Drift indicates that the data used to build the model has shifted from the data now seen in production.
Current production data against recent production data baseline: Drift indicates high variance in production data distributions, which could be indicative of model performance degradation, data quality issues, or noisy features.
Choose a Threshold
Monitors typically trigger an alert when your monitor crosses a threshold. Depending on your model needs, you can configure your own threshold or set an automatic threshold.
Auto thresholds automatically set the monitoring threshold on all monitors within Arize. This auto threshold is based on 14 days plus a three-day delay of historical data.
💡PRO TIP: remember to reset old thresholds, as they do not automatically refresh from when your monitor was first configured. Thresholds can become outdated as better or more data is collected. Sometimes a monitor fires when a threshold simply needs to be reset
Choose An Evaluation Metric
Drift Metrics
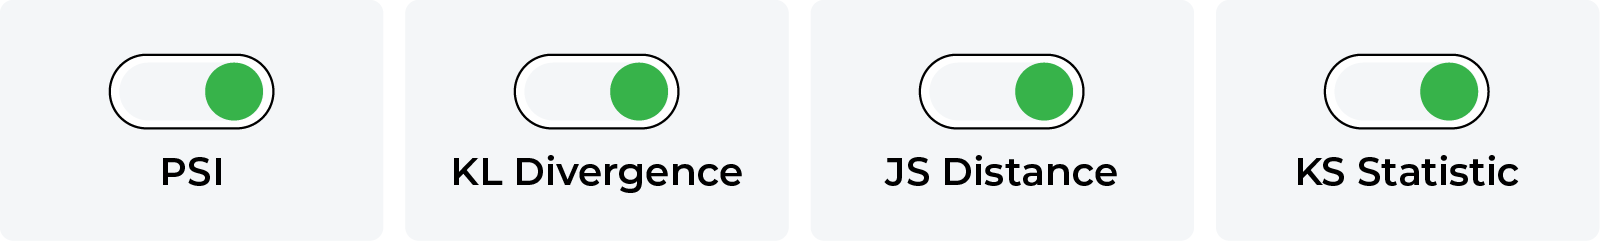
There are a wide variety of distributional drift metrics to choose from when setting up a monitor. Each metric is tailored to a specific use case. This guide dissects some common ones, including:
Performance Metrics
Similarly, performance metrics depend on your model type. Knowing which performance metric to use can make all the difference in comparing different environments for easy root cause analysis.
Model Monitoring Alerts
Once monitors are set up, it’s important to ensure the team gets and sees alerts when a model deviates from its expected ranges. It’s important for an ML monitoring platform to integrate with prevailing alerting tools. Arize, for example, lets teams send an alert via email, Slack, OpsGenie, and PagerDuty. Alert cadence and severity settings depend on a team’s preferences and use cases. Alert grouping is often useful if individual alerts are set for correlated features that may all fire simultaneously. The model metadata within alerts are helpful in expediting the troubleshooting workflow.
How To Respond To An Alert

Platforms vary in their approach. Arize monitors, for example, has three different stages:
- Healthy: No action is needed
- No data: a ‘no data’ status indicates that the monitor does not have recent data in the evaluation window. This can be resolved by extending the evaluation window or uploading new data to Arize. All live models should be configured to continuously send your model’s latest data in batch or real-time operations to keep monitors up-to-date.
- Triggered: Time to troubleshoot! Drift and performance tracing can help root cause model issues and pinpoint specific feature values or cohorts of data where the model is performing poorly.
💡 PRO TIP: Many model issues can be resolved by retraining a model with targeted training data uncovered in Arize’s troubleshooting workflows.
Model Monitoring: Frequently Asked Questions (FAQs)
Which team should own the monitoring and alerting?
A: The right answer depends on your organization and defined roles and responsibilities. A common pattern is for engineering teams, such as a central ML team, to own the alerting systems.
If it’s a simple resolution, like an issue configuring the monitor, or if the root cause appears to be the data transformations or ML pipeline bugs, then engineering owns the resolution. If the issue is likely a deeper issue with the model, then it is escalated to data science or the original model owner to resolve.
What is the difference between monitoring baselines and evaluation windows?
A: An evaluation window is the same as a moving average. Increase your evaluation window to smoothen unstable metrics or cover data gaps. The evaluation window defaults to 72 hours for drift and performance and 24 hours for data quality.
Model baselines are only used for monitors that track changes between your production data and your baseline, such as drift monitors or our new values/missing values data quality monitors. Your model baseline can either be from training, validation, or a past period of time of your production data.
How does model monitoring relate to ML observability?
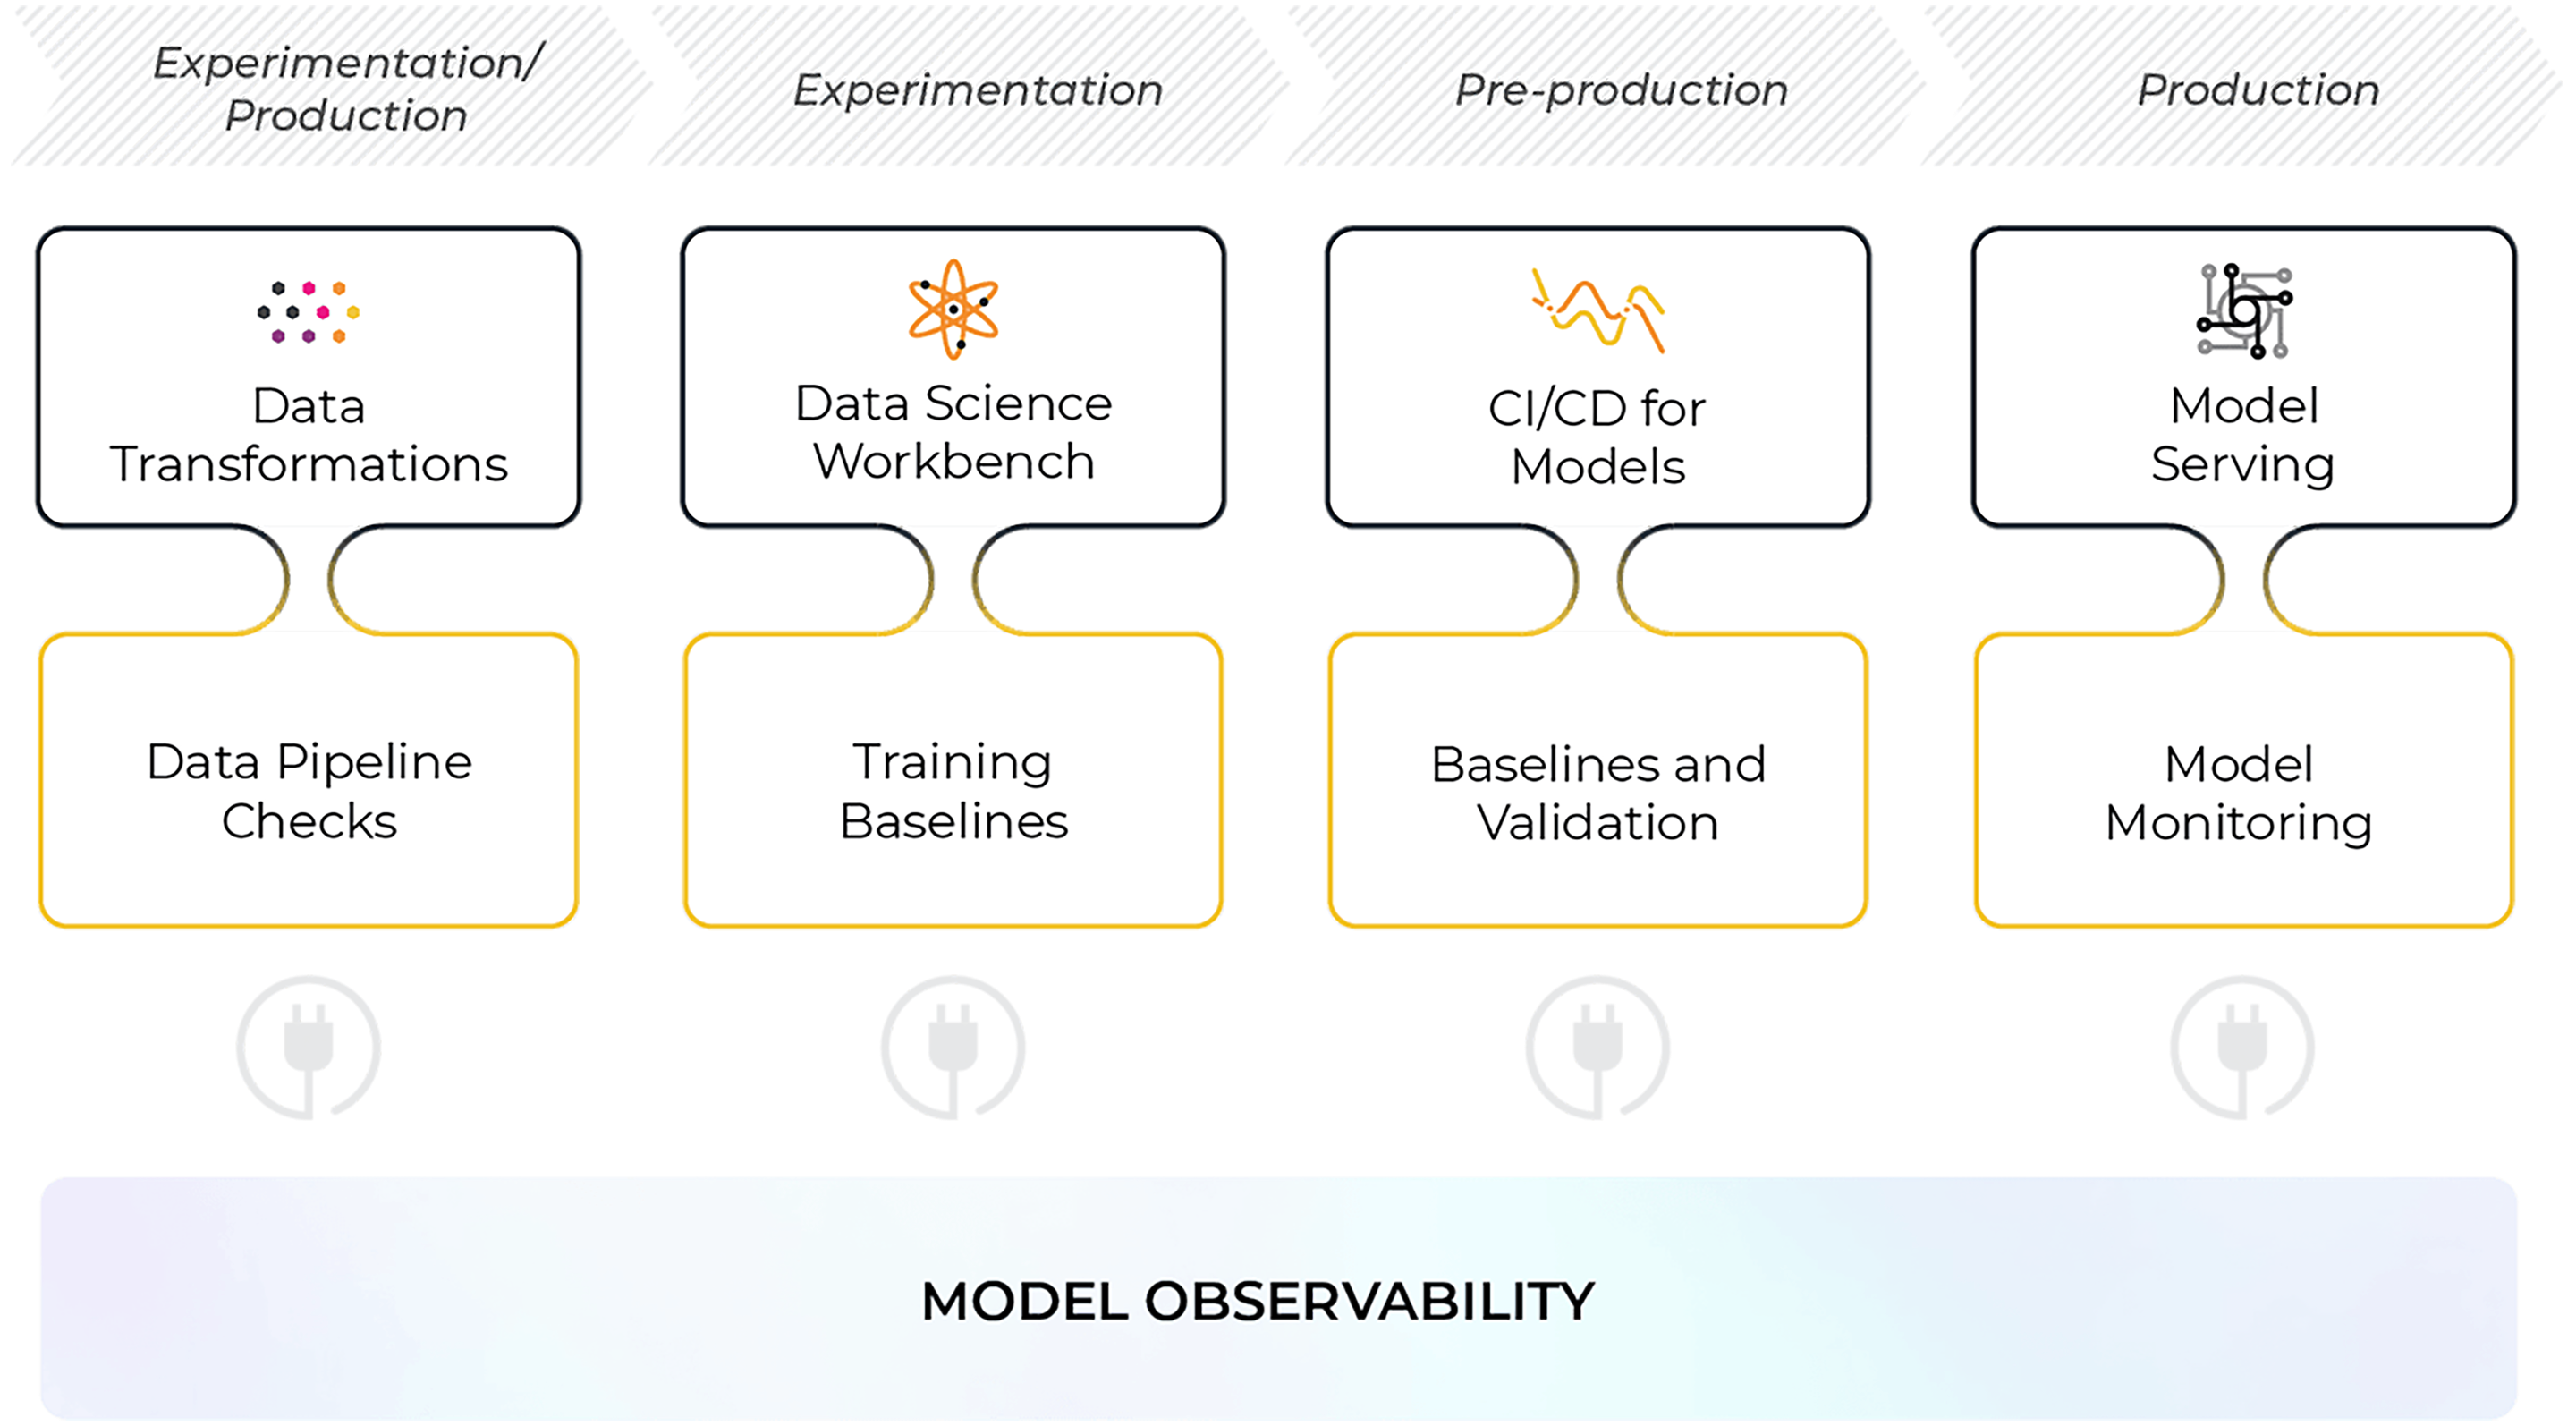
A: There are many failure modes a model can encounter at any given time, and monitoring your model’s performance in production is the first step to gaining confidence in your models as you move to online environments. Machine learning monitoring is a component of ML observability, a tool used to monitor, troubleshoot, and explain your models in production to drill down to the why behind the decisions your models make in production.
ML observability interacts with every part of the model building lifecycle. From experimentation to production, observability helps troubleshoot problems with data ingestion, training/validation, and serving workflows. While bringing a model online can be challenging, ML observability helps alleviate the burden of troubleshooting issues during the model building and serving process to ensure the highest quality model is served in production.
What are some common model monitoring use cases?
A: Improving model visibility by monitoring can maximize revenue, improve productivity, and increase trust in your ML models. Common model monitoring use cases:
- Monitor and achieve observability for LLM applications.
- Ensure your NLP sentiment classification model is performing optimally in production, analyzing embedding drift.
- Set up proactive monitors for chargebacks (false negative rate) and false positive transactions for your credit card fraud model.
- Troubleshoot bad data quality, drifting features, and low performing cohorts of your ad click-through rate model.
- Analyze your recommendation engine model’s performance across various slices and dive into which features could cause performance degradation.
- And many more.
What should I monitor in production?
A: The answer depends on what can go wrong. There are a number of model failure modes to be on the lookout for, and they rarely affect your model in isolation. To piece together why your model’s performance may have degraded or why your model is behaving erratically in particular cases, you must have the proper measurements to piece together what’s going on. Model monitoring tools fill this role in the machine learning workflow and empower teams to constantly improve your models after they’ve been shipping into the world.
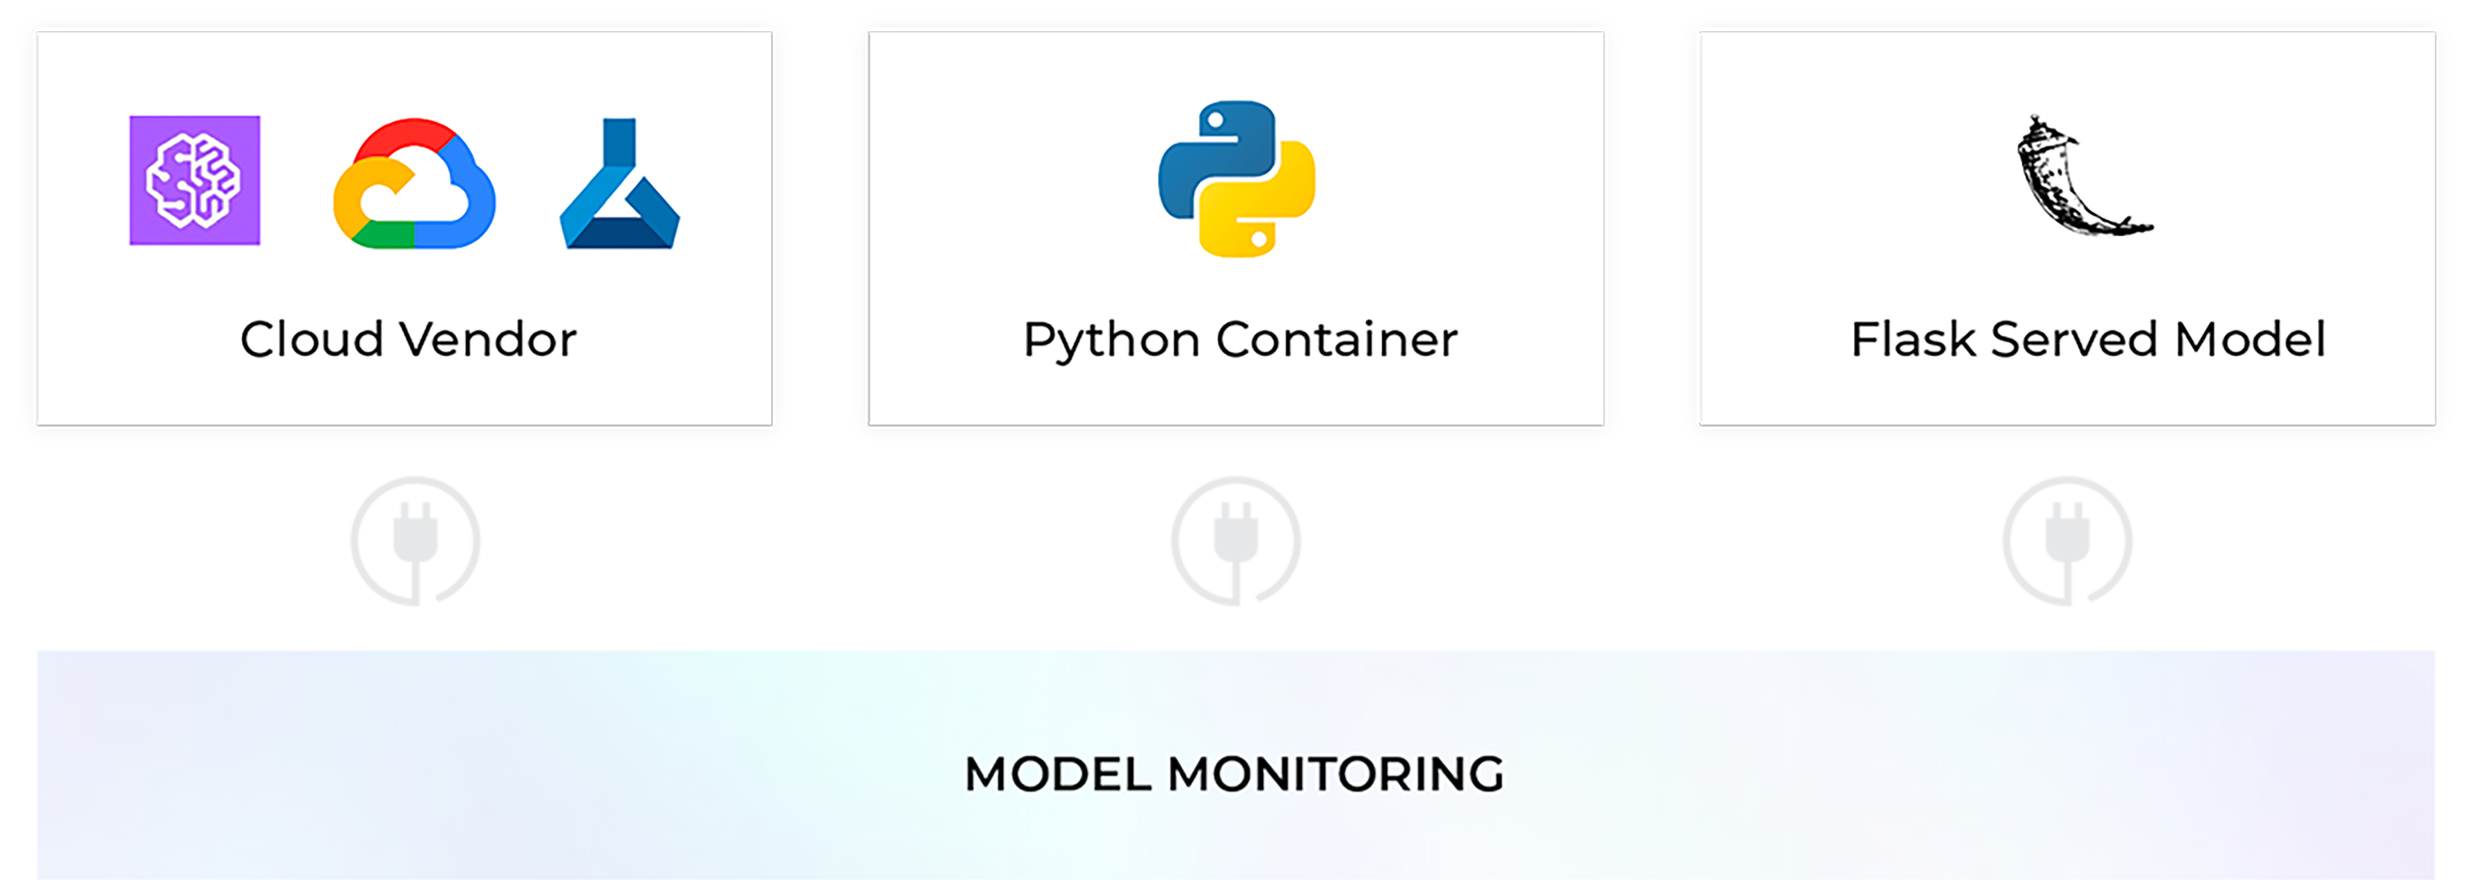
Monitor Across Different Serving Options
Easily integrate with any serving option to simplify the production process
Model Monitoring from Arize
With the right monitoring tool, you should easily create dashboards to deeply analyze and troubleshoot your models across training, validation, and production. From handling biased actuals to no ground truth to troubleshooting traces and spans, proactive monitoring should be able to handle your model or generative AI system at its worst. Automatically surface feature values or spans that harm your overall performance, chain together filters to drill down to the why, and find the root cause of your performance degradation.