
What Is Mean Absolute Percentage Error?
One of the most common metrics of model prediction accuracy, mean absolute percentage error (MAPE) is the percentage equivalent of mean absolute error (MAE). Mean absolute percentage error measures the average magnitude of error produced by a model, or how far off predictions are on average. While understanding this metric and how to calculate it is important, it’s also critical to understand its strengths and limitations when using it in production.
A machine learning model may only be as good as the data used to train it, but the overall model evaluation is based on the performance metrics used in production. If your data is inconsistent – skewed, riddled with outliers, or zeros and nans – the performance metric you choose will be responsible for understanding the effectiveness of your model and catching these issues. In order to measure the performance of the model’s predictions against its ground truths (also known as actuals) and gain a deeper understanding into how your model impacts user behavior, profitability, and other key performance indicators (KPIs) you must first pick a performance metric to appropriately fit the use case. To help model developers better understand the nature of MAPE, this post covers:
- What is MAPE and how is MAPE calculated?
- When is MAPE used in model monitoring?
- What are the limitations when using MAPE?
- How are ML teams leveraging MAPE in production?
How Do You Calculate Mean Absolute Percentage Error?
Mean absolute percentage error is an evaluation metric used to measure the accuracy of predictions across industries, such as in finance and economic forecasts. MAPE is often used as the loss function in regression problems and forecasting models due to the intuitive interpretation in terms of relative error for evaluation. Also known as the mean absolute percentage deviation (MAPD), MAPE is defined as the average absolute percentage difference between predicted values and actual values.
Equation 1: MAPE calculation
Where:
- N is the number of fitted points;
- A is the actual value;
- F is the forecast value; and
- Σ is summation notation (the absolute value is summed for every forecasted point in time).
Mean absolute percentage error measures the average magnitude of error produced by a model, or how far off predictions are on average. A MAPE value of 20% means that the average absolute percentage difference between the predictions and the actuals is 20%. In other words, the model’s predictions are, on average, off by 20% from the real values. A lower MAPE value indicates a more accurate prediction – an MAPE of 0% means the prediction is the same as the actual, while a higher MAPE value indicates a less accurate prediction.
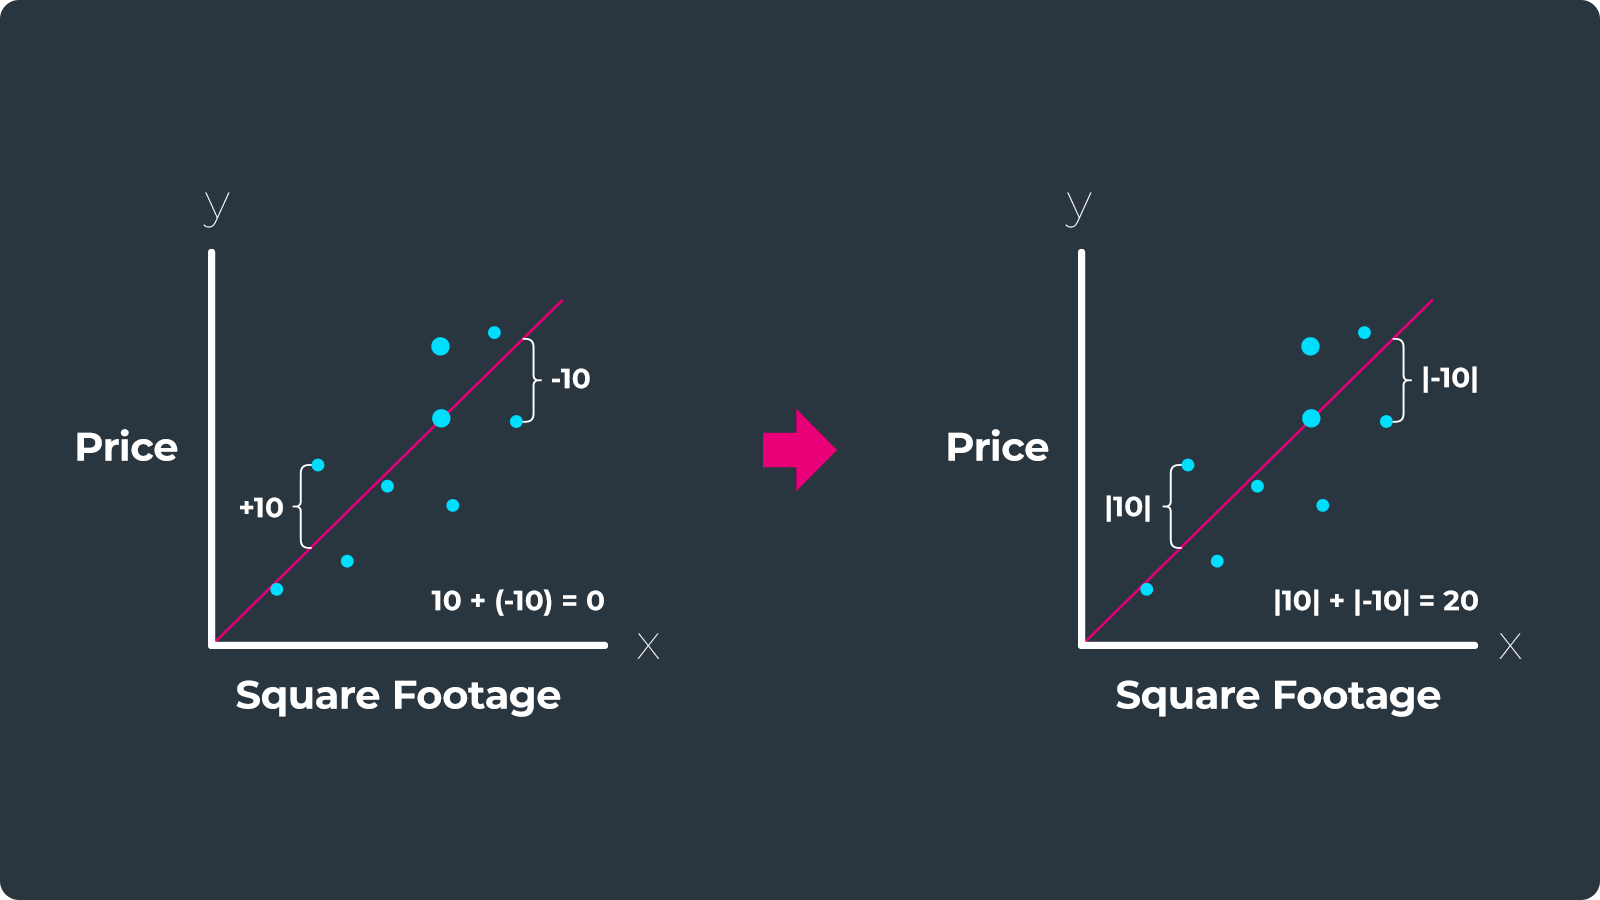
To calculate the mean absolute percentage error, we first calculate the absolute value of all the residuals. We take the absolute value of the errors because we do not want positive and negative errors to cancel each other out. If our model overshoots one data point by +10 and undershoots another by -10, these errors would cancel each other out because (-10) + 10 = 0. But by taking the absolute value of the errors we avoid this problem, because |10| + |-10| = 20.
Once we calculate the absolute value of a residual, we divide this value by the original data point and multiply by 100 to figure out how far off our model is as a percentage. We then add all these percentages up and divide by the total number of data points to get our mean absolute percentage error.
A MAPE of 20% may be considered good or bad depending on the situation, the degree of variability in the data, the range of actual values, or the desired level of accuracy. MAPE is used once a regression model finds a line of best fit between the input features and the target variable and is being tested on new inferences in production. The metric is also useful for ongoing model monitoring once deployed.
What Are the Limitations of Mean Absolute Percentage Error?
In determining whether to use MAPE, one of the most important things to understand is how prominent and consequential outliers are to your use case. MAPE is ideal in the cases where there are little to no: outliers, values near zero, values at zero, and low volume / sparse datasets.
Mean absolute error and mean absolute percentage error may be less sensitive to outliers than alternative metrics, such as root mean squared error (RMSE), but even actual values that are on the small end of the value range in a dataset can explode MAPE towards infinity.
Alternatively you can use a symmetric mean absolute percentage error (SMAPE) (Goodwin & Lawton, 1999) or a weighted MAPE (Kolassa & Schütz, 2007). However, while SMAPE handles extreme ranges better than MAPE, it will break down like MAPE when the actual values are zero or close to zero.
Table 1: MAPE for forecasting
Week # | Day | Prediction | Actual | APE = [abs (Actual – Prediction) / Actual] *100 |
Week 1 | Monday | 2.00 | 1.00 | 100.00 |
Tuesday | 3.00 | 1.00 | 200.00 | |
Wednesday | 1.00 | 2.00 | 50.00 | |
Thursday | 2.00 | 3.00 | 33.33 | |
Friday | 3.00 | 6.00 | 50.00 | |
MAPE | 86.67 | |||
Week 8 | Monday | 102.00 | 101.00 | 0.99 |
Tuesday | 103.00 | 101.00 | 1.98 | |
Wednesday | 101.00 | 102.00 | 0.98 | |
Thursday | 102.00 | 103.00 | 0.97 | |
Friday | 103.00 | 106.00 | 2.83 | |
MAPE | 1.55 |
In Table 1, we calculate the MAPE for a new restaurant that is trying to predict how many customers will come in Monday through Friday during open hours. Let’s look back on week one and week eight to see how MAPE changed, with the only difference being the addition of 100 to each value in week eight from week one.
Observations on absolute percentage error (APE)
- Week 1, Monday
- With an actual = 1 and a prediction = 2, you might be tempted to say this is off by 50% – but from the APE calculation, the error actually comes out to 100%. Note that if actual = 2, the APE would be a perfect 0%.
- Week 1, Tuesday.
- Although APE is commonly used due to the intuitive interpretation, it isn’t a normalized metric and can exceed 100% when the model’s predictions are, on average, off by >100% from the actual value. Here, APE = 200% but it’s only off by two customers.
- Week 1, Wednesday
- APE should be used only if the observations have relatively large actual values; since actual = 2 and the prediction = 1 here, APE = |2-1| / |2| = 50%. This shows the prediction ability of your model is no better than a coin flip.
- Week 1, Thursday
- Here we have a similar case to Monday, but it is not an identical case. On both days, prediction = 2 but now the actual = 3 whereas the actual number of customers that came in on Monday was one. This is the same delta in customers (both days were off by one customer), but APE = 33% is three times better than APE = 100%. This demonstrates a tendency for APE to be biased towards low predictions.
- Week 1, Friday
- Here we once again have an APE = 50%, but we are off by 3 customers, as opposed to only being off by one customer on Wednesday.
In the use case from Table 1, we can see that the Week 2 MAPE of 1.55% is a much better score than the MAPE of Week 1 at 86.67%. But what really changed? The forecasting model for prediction is the same, as well as the delta of customers missed between the prediction and the actual. In reality, the amount (or volume) of data increased. Since MAPE has a tendency to be biased towards low predictions, it is not the best metric to represent how well the model is doing at low values.
What if instead of tracking the number of customers this model tracks a ratio like profit per customer? Rows would become undefined for values equal to zero or infinity when the actuals are very close to zero. When you encounter an “infinity” error or a “division by zero” error,, we recommend either using a different metric such as RMSE (assuming you don’t have large outliers). Datasets that have zeros and infinities that use MAPE as the loss function have similar difficulties when trying to run optimizations in order to minimize errors.
If you do have large outliers as well as zeros in your inferences, then try an alternative regression metric like MAE, RMSE, MSE, R-Squared, or mean error. One thing that should be avoided is changing the actual (ground truth) value by either adding an integer to each inference and prediction value or by dropping periods with zero actuals all together (Hoover, 2006). We care about the true values of our inferences, as well as whether or not our model is predicting zeros. Changing and deleting data will only get a misrepresentation for your model’s ability to predict, as well as issues in the retraining process. It is always better to change the metric and/or model than to change the data to meet your needs.
How Is Mean Absolute Percentage Error Used In Model Monitoring?
It’s important to keep in mind that MAPE is a relative measure, and the interpretation of the value depends on the specific context and the data being evaluated. There is no industry standard for what the MAPE should be for a good model, it should just be relatively good compared to a naive approach. For example, if you are in an industry where prices are stable, MAPE will likely stay low even if you are using a model that predicts prices from last month will be the average this month, or if the prices this month will be an average over the last several months. However, if you work in high frequency trading, you may have sophisticated, well performing forecasting models, but they will likely have a much higher MAPE.
ML observability platforms like Arize make it easy to monitor the stability of your mean absolute percentage error over time to give your team confidence in production. The way this works is to first upload your regression model inputs and outputs into the Arize platform through either a cloud storage integration, SDK or API.
The predictions are then given an ID, grouped by a user-selected time period, and connected with features, embeddings, explainability values and metadata. The actuals, or inferences from the real world, are linked to the prediction whenever they arrive via the prediction ID. From this, we can set monitors that automatically calculate the MAPE between two reference datasets, the baseline and current dataset (the baseline normally corresponds to the model’s training data and the current dataset is the production dataset).
Since MAPE is calculated on linked-back actuals and actuals can be delayed by days, weeks or months (think insurance claims), there might be some instability in the MAPE at small time windows. At the same time, it’s important to keep an eye on situations where there are only a small number of daily predictions. If you only receive a small number of predictions or actuals during a certain time period, the measurement may end up having a large variance. Bootstrapping the sample in the window can help visualize and understand the variance, but we would recommend first selecting a different metric to monitor that would be more stable to low volume, or to increase your evaluation window.
Conclusion
Regression models are commonly used in machine learning and it’s essential to have a good understanding of the key differences among the major metrics and be aware of the nuances when using them in practical scenarios. This post aims to provide you with a comprehensive understanding of when to use mean absolute percentage error.
For teams looking to implement robust production monitoring with custom metrics, understanding MAPE is just one piece of the puzzle. To learn more about what is ML observability and discover unexpected ways to use ML observability, explore our resources or join the community to discuss best practices with other ML practitioners.
Frequently asked questions
What is mean absolute percentage error and when should I use it?
Mean absolute percentage error (MAPE) is a metric that measures the average magnitude of error produced by a model as a percentage. It’s best used when you need an intuitive, percentage-based understanding of prediction accuracy and your dataset has relatively large actual values with few or no zeros, outliers, or sparse data points. MAPE is commonly used in forecasting and regression problems across industries like finance and economics.
How does MAPE differ from other regression metrics like MAE or RMSE?
Unlike mean absolute error (MAE) which measures error in absolute terms, MAPE expresses error as a percentage of the actual value, making it easier to interpret across different scales. While RMSE is more sensitive to outliers, MAPE provides a relative measure that can be compared across different datasets. However, MAPE has significant limitations with zero or near-zero values and tends to be biased toward low predictions, which may make alternative metrics more appropriate depending on your use case.
What are the main limitations of using MAPE for model evaluation?
MAPE has several critical limitations: it becomes undefined or approaches infinity when actual values are zero or close to zero, it can exceed 100% when predictions are far off, it tends to be biased toward low predictions, and it struggles with datasets containing outliers or sparse data. When encountering these issues, consider using alternative metrics like MAE, RMSE, or R-Squared, or explore symmetric MAPE (SMAPE) as a potential alternative.
How can I monitor MAPE in production machine learning systems?
To effectively monitor models in production using MAPE, you need to link predictions with their corresponding actuals (ground truth values) via prediction IDs. An ML observability platform can automatically calculate MAPE over time by comparing baseline datasets (typically training data) with current production datasets. Keep in mind that MAPE may show instability in small time windows, especially when actuals are delayed or prediction volume is low, so selecting appropriate evaluation windows is important.
What is a good MAPE value for my model?
There is no universal industry standard for what constitutes a “good” MAPE value – it depends entirely on your specific context, data characteristics, and business requirements. A MAPE of 20% means predictions are on average off by 20% from actual values. In stable environments with predictable patterns, even simple models may achieve low MAPE values, while sophisticated models in volatile domains like high-frequency trading may have higher MAPE values yet still perform well. The key is to compare your model’s MAPE against a naive baseline approach relevant to your use case.