ax tasks create and ax evaluators create. Concept-side, they break down into four ideas: scope, filters, sampling, and cadence.
Scope: the level the evaluator runs at
Scope is the evaluation level the evaluator runs at — span, trace, or session. The underlying knob on the evaluator is--data-granularity span|trace|session.
Scope is set on the evaluator template, not the task. Once an evaluator is created at span scope, every task using it runs at span scope. To evaluate the same question at a different scope, you build a different evaluator.
Filters: which spans qualify
All three controls — filters, cadence, and sampling — are configured in the same place: the New Task form when an evaluator gets deployed to a project.
The New Task form: target data with filter, evaluators, cadence, sampling rate, and the Advanced disclosure all live in one place.
For span-level evaluators, the task data filter is enough — there’s nothing inside a span to further filter, so the evaluator data filter doesn’t apply.
For trace and session evaluators, the two filters chain. Read them as a pipeline:

The two-filter chain — task data filter selects sessions, evaluator data filter selects spans within them.
financial_data_agent was involved.
- Task data filter =
name = "financial_data_agent"— restricts the task to sessions that touched the financial agent. - Evaluator data filter =
parent_id IS NULL— within each qualifying session, pass only the root spans to the prompt (the user-facing messages).
Sampling: how much of the population
Most production applications generate more traces than you want to evaluate. Sampling lets you score a representative fraction instead of all of them. The CLI flag is--sampling-rate (a float between 0 and 1).
When to sample below 100%:
- High volume + LLM-as-a-judge. A continuous evaluator running on 100% of traces in a high-volume application can run up a serious LLM bill. 1–10% is a common production setting.
- Cost-controlled experiments. When you’re validating a new evaluator and don’t yet trust the prompt, sampling protects you from a runaway loop.
- Code evaluators. Effectively free; sample for completeness.
- Low volume. A small project might generate hundreds of traces a day; sampling buys nothing.
- Guardrail-style evaluators. If the eval is meant to detect rare failures (a competitor mention, a policy violation), sampling defeats the purpose — the rare failures get sampled out.
Cadence: when the evaluation runs
Cadence is the answer to when does the evaluator fire? Two options:
The CLI flag is
--is-continuous / --no-continuous. The recommended workflow when launching a new evaluator: run historical first, verify the scores look right, then switch to continuous.
Running historical first catches the cases where the prompt looks reasonable but the evaluator scores everything correct (or incorrect) — i.e., the judge isn’t actually doing the work. Catching that against a known batch of traces is cheap; catching it after a week of continuous production runs is not.
Expanding the Advanced disclosure on the task form exposes the remaining levers — LLM override (use a different judge model than the template’s default for this specific task) and Enable Tracing (capture traces of the evaluator’s own LLM calls, useful when debugging a misbehaving judge):
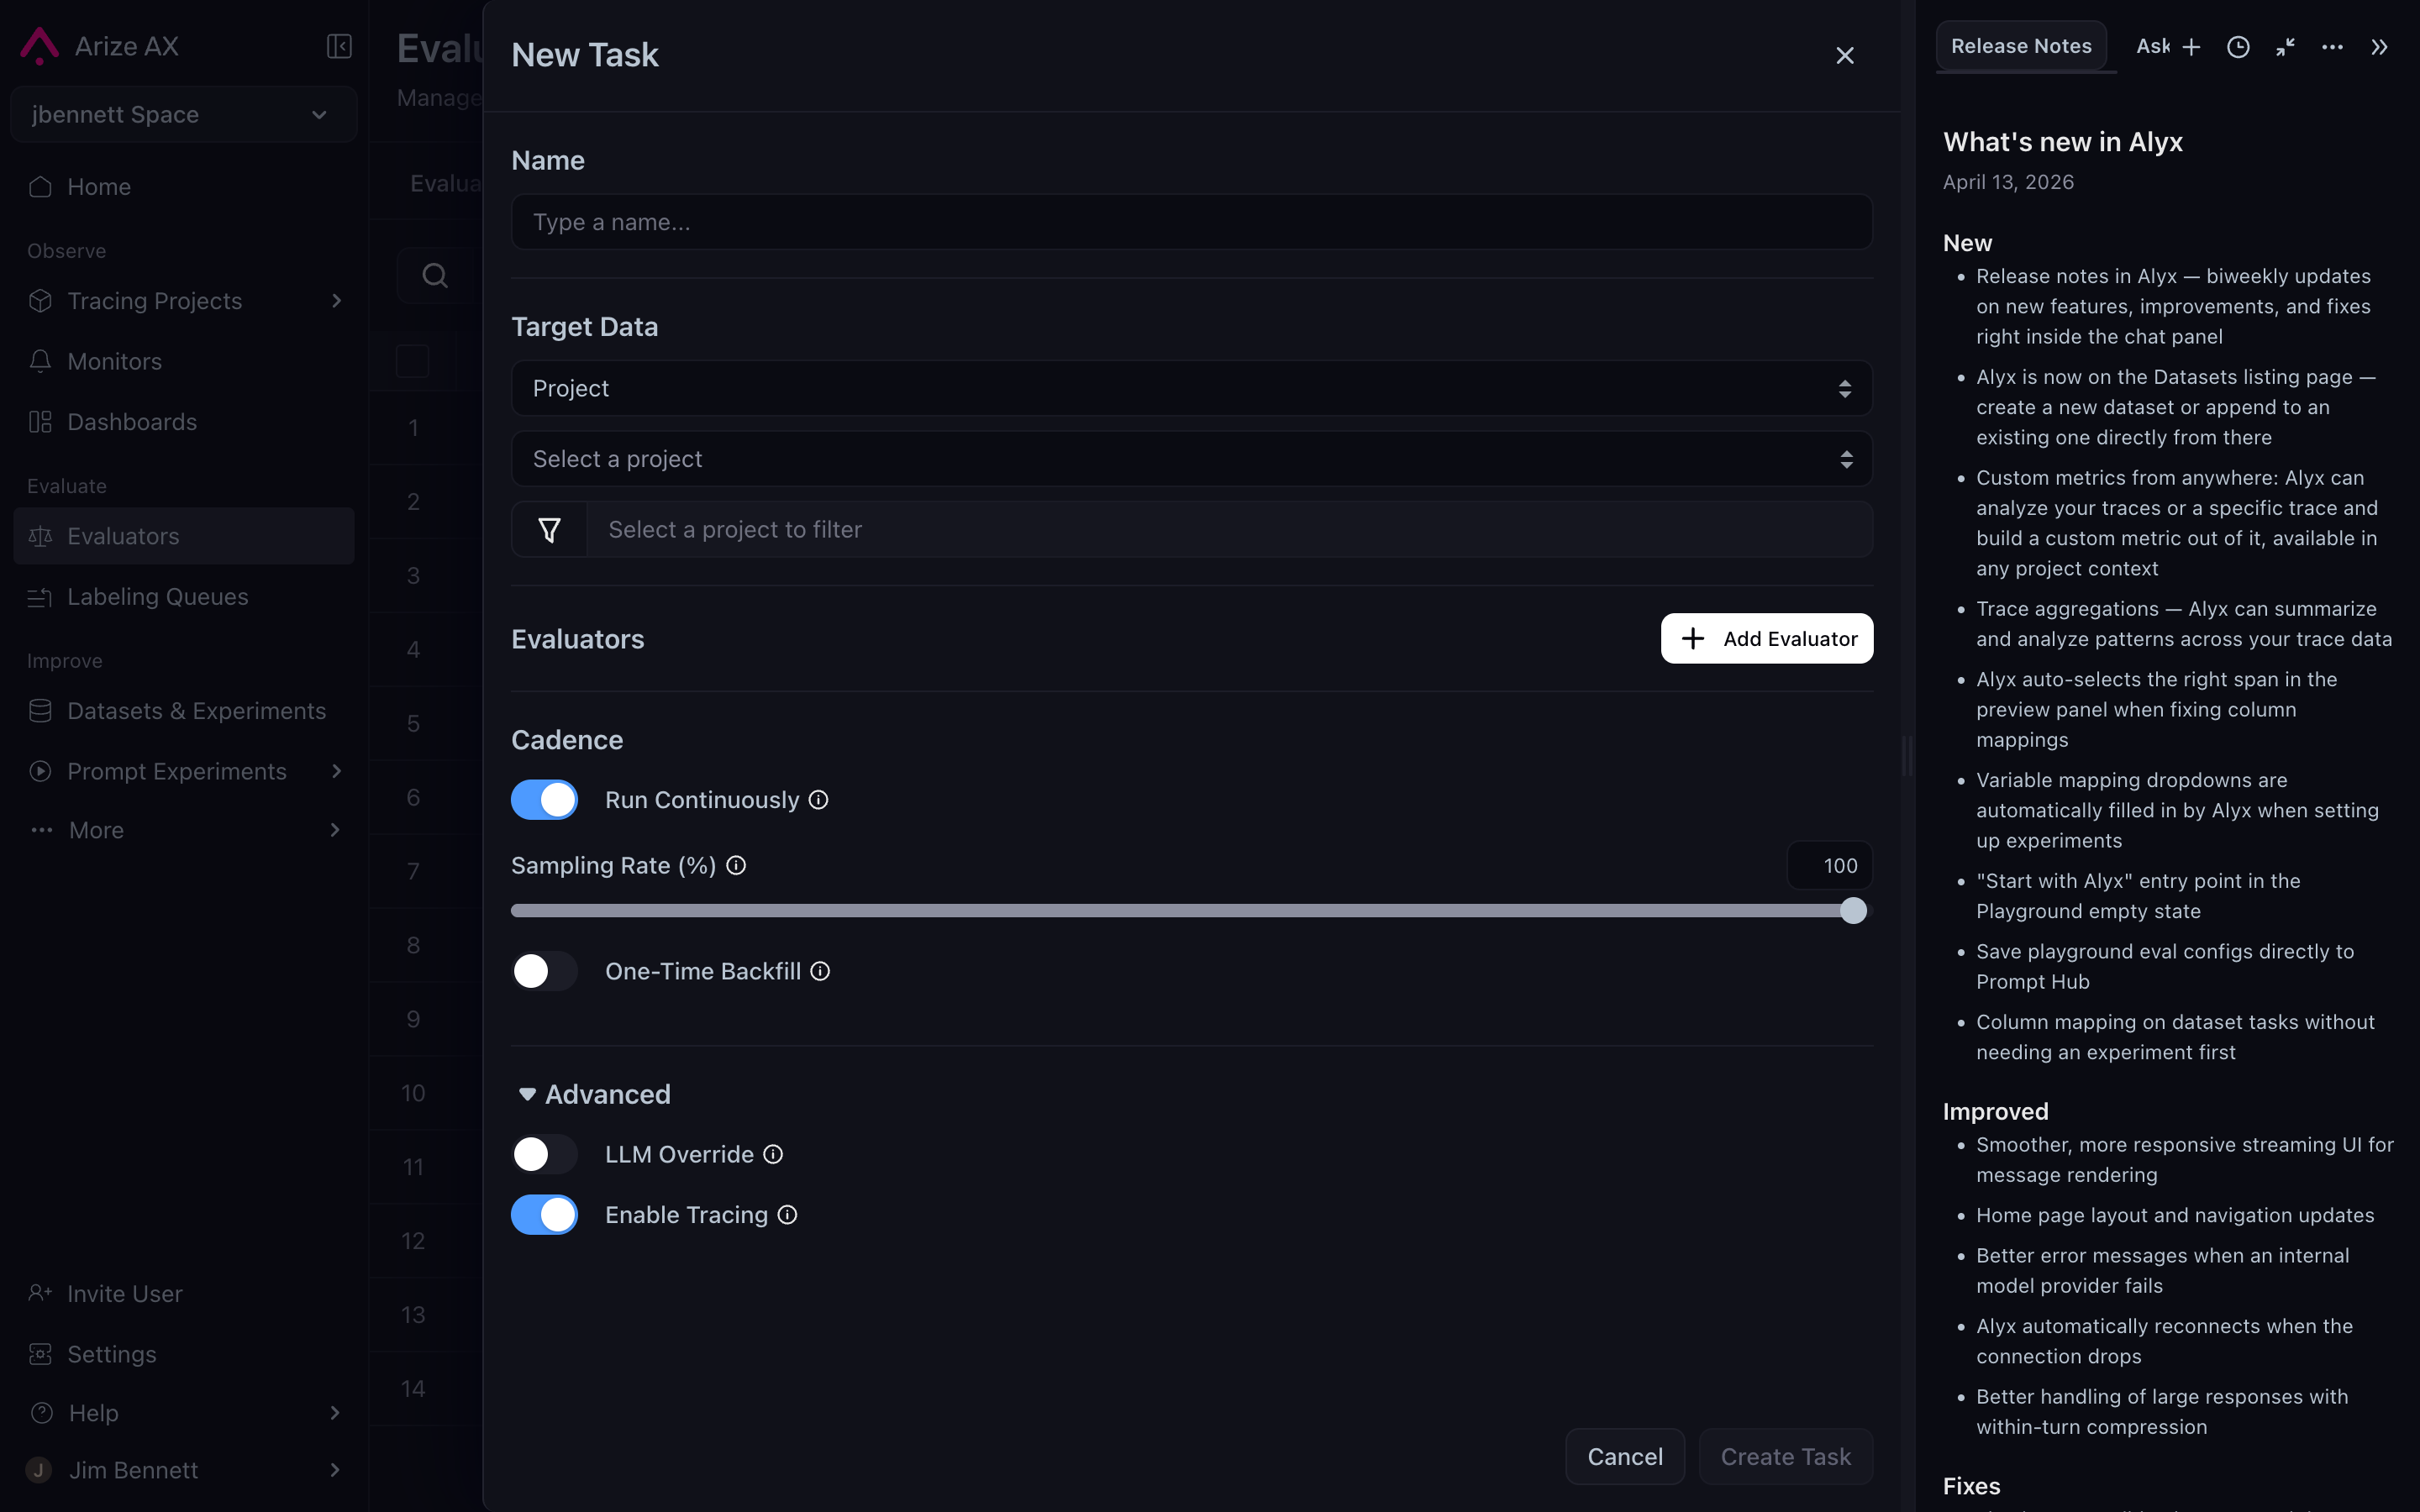
The Advanced section adds LLM Override and Enable Tracing on top of the standard Cadence and Sampling Rate controls.
Variable mapping: reusing templates across projects
The other knob on the task — easy to miss — is variable mapping. The evaluator template names placeholders like{summary} and {original}. The mapping says, in this specific task, fill {summary} from attributes.llm.output_messages.0.message.content, and {original} from attributes.llm.input_messages.1.message.content.
Mappings live on the task, not the template. The same template can be deployed against many projects whose attribute paths differ — a summarization agent in one project might emit its output as attributes.llm.output_messages.0; another might emit it as attributes.output.value. The template stays the same; the mapping changes per task. For the full attribute namespace, see Semantic conventions.
This is part of why authoring with Alyx is a meaningful productivity unlock — Alyx auto-detects the right attribute paths when you point it at a project, so the variable mapping fills itself in. See Online LLM-as-a-judge.
The full set of knobs
A summary table. Every knob here corresponds to a real flag on theax CLI, which means every concept on this page maps to a verifiable underlying mechanism:
You don’t need to use the CLI to use evaluators — the Arize AX UI exposes everything here through forms — but the CLI flags are the canonical names for these controls and a useful disambiguation when documentation gets ambiguous.